
Charts 2022
Video Tutorial
Trade the Volume: the Footprint
Setting indicators with colored areas
Drawings – How to play with drawings
Overview
The 2022 edition is a complete platform suitable for the trader’s first experiences and an irreplaceable companion for the professional trader.
The graphic interface is simple and intuitive and all the functions can be used through the interactive menus that lead the user to realize his idea of visualization and therefore help him for a more effective trading.
Chart Trading is very intuitive and also allows combinations of complex orders such as the Order Cancel Order or the Bracket Order. The selection of Limit or Stop Order is automatic.

Create a Chart

A Chart can be created from the Quick Start page (which is the first page visible when beeTrader is opened), from the File menu and from the New menu.
Once you have clicked the button, you need to select the symbol of the asset you want to use. For convenience, there are already more than 1000 assets and will be presented to the user. If you wish to insert other symbols, refer to the manual of Symbol Manager.
The graph creation window has the following parameters:
- Data Symbol: clicking the “Select” button shows the list of assets already available for the broker used. If you wish to insert other symbols, refer to the manual of Symbol Manager.
- Current: once the asset has been selected, its name is displayed;
- Periodicity: it is the period chosen for the creation of the Chart;
- Bar Interval: is the number of periods for the creation of the Chart, it works in conjunction with Periodicity. In the example the time frame of the Chart will be 5 minutes;
- Bar History: is the number of historical data that will be requested from the broker according to previous choices. Please note that some brokers have limitations in the historical data available;
- Change Orders Symbol: if flagged it indicates that while the Chart will be created using the historical data of one broker, the orders will be executed on another broker. beeTrader allows to use more than one broker at the same time;
- Order Symbol: clicking the “Select” button shows the list of assets already available for the broker to send the orders to. If you wish to insert other symbols, refer to the manual of Symbol Manager.
- Current: once the asset has been selected, its name is displayed;
- Filter Time Session: if flagged, it enables the fields below to filter the historical data displayed on the Chart;
- View Data From: if flagged, it enables the fields below to filter the historical data displayed on the Chart;
- View Data To: is the final time of the historical data displayed on the Chart
- Trading Times: indicates the session times of the asset’s membership market. If you want to make changes, please refer to the manual of Symbol Manager.
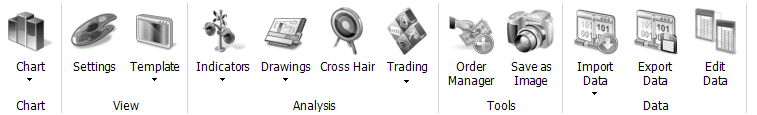
Main menu
The main menu contains the commands necessary for using the graphic document, and is displayed in the upper part of the application window.
The main menu contains the following controls:
- Chart -> New Chart: Create a new graphic document within the application;
- Chart -> Open Chart: Opens a graphic document from a file that has been previously saved;
- Chart -> Save Chart: Save the graphic document on file;
- Chart -> Clone Chart: Clone the current graphic document into a new document within the application;
- Settings: Opens the chart settings window;
- Template -> Load Template: Opens a Template from a previously saved file;
- Template -> Save Template: Save the template of the graphic document on file;
- Template -> Set as Default: Set the Template of the current graphic document as the base Template for all graphic documents that will be created later;
- Indicators -> Search: Opens the search window for Indicators that can be added to the current graphic document;
- Indicators -> Most Common: Lists the most frequently used Indicators;
- Indicators -> Other items: List of Indicators that can be added to the current graphic document;
- Drawings -> Format Object: Opens the window for setting the Drawing currently selected on the chart;
- Drawings -> Clear Drawings: Removes all drawings from the chart;
- Drawings -> Other items: List of Drawings that can be added to the current graphic document;
- Cross Hair: Enable or disable the Cross-Hair functionality on all graphic documents;
- Trading: Opens or closes the sidebar where the Real-Market Trading and Paper-Trading tools are located as well as numerous analyzes;
- Order Manager: Opens a new Order Manager document that contains the list of all orders sent to the real market;
- Save as Image: Save an image of the current graphic document to file;
- Edit Data: Opens the window for editing the values displayed in the chart;
Selection controls

Located at the top left of the chart we find the main commands for managing the chart. In order, from left to right, we find:
- Symbol selection box from which you can access the list of available assets;
- Selection box of the most commonly used Time Frames, it is possible to have customized Time Frames by clicking on the Settings button of the Main Menu;
- Box for selecting the desired number of bars for the selected Time Frame; the number of bars can be customized by clicking on the Settings button in the Main Menu;
- Selection box to view theVolumes of trades that took place on the current chart;
- Settings button relating to the type of display of the trade volumes chosen in box 4;
- Group selection box. It is possible to select groups of 2 or more charts and set which characteristics are shared between them in such a way that by changing the setting on a chart it is replicated on all charts belonging to the same group;
- Button for the settings relating to the characteristics of the chart that you want to share in the editing group. In fact, it is possible to share changes on Symbols, Time Frames, Indicators or complete Templates;
- Button to open or close the sidebar where the Real-Market Trading and Paper-Trading tools are located as well as numerous analyzes;
Panel headers
Panel headers are command blocks located in the upper left corner of each chart panel. There are 3 different types of headers. To open these menus, simply click with the left mouse button on the header.

Chart Style Header Menu

This type of header is the main one, always present on each chart, because it relates to the series of historical data drawn on the chart. The header always displays the Chart type, or Chart Style, currently in use, and optionally also the Realized and Open Position items relating to the Profit / Loss obtained on the chart through manual orders, Backtest or Strategy.
This menu contains the following items:
- Settings -> Style Settings: opens the specific setting window of the chart type currently in use; you can also use the Shift + Click shortcut on the header to open this setting window;
- Settings -> View Settings: opens the chart setting window, which includes all the items;
- Add Indicator: opens the indicator search window, to add a new indicator to the chart;
- Chart Style: each item in this submenu selects the corresponding chart type, or Chart Style; The chart type currently in use is always displayed in the title of the header;
- Show Profit/Loss or Hide Profit/Loss: shows or hides the Realized and Open Position items relating to the Profit / Loss obtained on the chart through manual orders, Backtest or Strategy directly in the title of the header;
- Colored Areas: opens the window for setting the color zones of the chart panel;
Only if there are more panels in the chart, the following items are also present:
- Move Panel Up: move the chart panel up one position;
- Move Panel Down: moves the chart panel down one position;
- Maximize Panel: maximize the chart panel, minimizing all other panels;
- Minimize Panel: minimize the chart panel, giving more space to the other panels;
- Restore Panel: when a panel is maximized or minimized, this command restores its previous dimensions;
Overlay Indicator Header Menu
This type of header is present for each indicator present on the same panel as the historical data of the chart, i.e. for each indicator in the Price Overlay.
This menu contains the following items:
- Settings: opens the window for setting the indicator; to open this setting window it is also possible to use the shortcut Shift + Click on the header of the indicator itself;
- Edit Indicator Script: opens the Script of Indicator in EasyScript Editor;
- Delete Indicator: Delete the indicator from the chart; this command can also be reached using the shortcut Ctrl + Click on the header of the indicator itself;
- Colored Areas: opens the window for setting the color zones of the chart panel;

Indicator Header Menu on separate panel

This type of header is present for each indicator present on the chart but in a panel other than the one used to draw historical data, i.e. for each indicate NOT in the Overlay on prices.
This menu contains the following items:
- Settings: opens the window for setting the indicator; to open this setting window it is also possible to use the shortcut Shift + Click on the header of the indicator itself;
- Edit Indicator Script: opens the Indicator’s script in EasyScript Editor;
- Add Indicator: opens the indicator search window, to add a new indicator to the chart;
- Colored Areas: opens the window for setting the color zones of the chart panel;
- Move Panel Up: move the chart panel up one position;
- Move Panel Down: moves the chart panel down one position;
- Maximize Panel: maximize the chart panel, minimizing all other panels;
- Minimize Panel: minimize the chart panel, giving more space to the other panels;
- Restore Panel: when a panel is maximized or minimized, this command restores its previous dimensions;
- Delete Indicator: Delete the indicator from the chart; this command can also be reached using the shortcut Ctrl + Click on the header of the indicator itself;
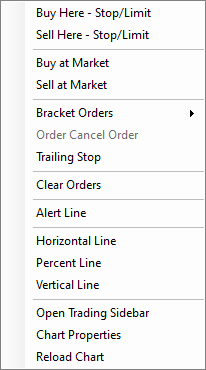
Chart Trading
Through the menu accessible with the right mouse button you can use all the Chart Trading functions that we see below in detail.
- Buy Here: enters a buy order at the price indicated by the mouse, the price after the entry can be modified;
- Sell Here:enters a sell order at the price indicated by the mouse, the price after the entry can be modified;
- Buy At Market: enters a buy order at the Market price, the order will then be executed immediately;
- Sell At Market: he enters a sell order at the Market price, the order will then be executed immediately;
- Bracket Orders: Enter a buy or sell order with the function Bracket Order;
- Order Cancel Order: if there are more active orders, it is possible to enable the Order Cancel Order function, that is, when one order is executed, the other is canceled;
- Trailing Stop: set the parameters necessary for the Trailing Stop as illustrated below on this page;
- Clear Orders: cancel all active orders on the Chart;
- Alert Line: draw a horizontal line that acts as an Alert. Upon crossing the Alert Line you will get a visual and optional sound warning;
- Horizontal Line: draw a horizontal line at the selected point. With the right button on the line you can proceed with the modification;
- Vertical Line: draw a vertical line at the selected point. With the right button on the line you can proceed with the modification;
- Open Trading Sidebar: opens a Trading Sidebar;
- Chart Properties: displays the chart setup window;
- Reload Chart: re download the historical data from the Data-Feed to be displayed on the chart.
Once you have clicked on the type of order you want to place, beeTrader offers a minimised DOM to provide the user with the ability to verify the correctness of the order he is about to send. In the mini DOM for At Market orders, the price is obviously not shown as the order will be sent in order to be executed immediately and therefore at the worst price between bid and ask. The settings in these mini books change depending on the broker on which you are operating.
In the Trailing Stop function it is necessary to set the profit at which the trailing stop must be activated and the percentage of the profit to be put back at risk before closing the position. As soon as the user’s chosen risk percentage is eroded, beeTrader will ‘send a market order to close the position.
Buy Here
Sell Here
Buy Market
Sell Market


When an order is entered on the chart it is represented as shown in the image and it is possible to cancel it with the X key and also to move the order simply by dragging it to the desired price. Any modification involves the cancellation of the previous order and the placing of a new order. By clicking on the quantity entered, a window opens immediately below the order to change the quantity.
Any operation on the orders sent can also be managed by the Order Manager.

Trading Sidebar

The Trading Sidebar is a panel on the right side of the chart that can be viewed when needed. In the Trading Sidebar there are several useful tools to manage the chart.
You can read all the information about the Trading Sidebar at this link.
Types of charts
The charts types represent the way in which historical data are drawn within the chart. There are numerous different charst types, from the simplest to the most advanced and modern ones, to allow a vision and a complete analysis of the historical series, according to one’s needs.
You can read all the information about types of charts to this link.

Colored Areas

For each panel of the chart it is possible to define colored areas that are enclosed between two values chosen from all those available in the panel. The colored areas give the interpretation of the indicators more immediate, allowing an easier reading of the market situation.
You can read all the information about colored areas to this link.
Indicators
In beeTrader you can find a large library of predefined indicators , which you can add and use immediately in your charts. Through the use of the beeTrader programming language EasyScript, it is possible to create a new customized indicators and extend beeTrader functionality according to your needs.
For the complete list of beeTrader predefined indicators indicators, including explanation and interpretation, you can read at this link.

Drawings

Volume Overlay
The Volume Overlay represent studies on the volume, both historical and real-time, which can be overlap on the price chart.
You can read all the information about Volume Overlay to this link.

Zoom

The bottom section of the charts and the right section respectively contain the X and Y axes of the chart.
In the X axis there are 2 rows of data, the first indicates the dates / times of the historical data displayed in the corresponding X coordinate on the various panels of the chart. The second row contains a calendar with a scrolling object that indicates the entire time interval available for the chart and which part of the interval is currently displayed, corresponding to the highlighted section of the row. By clicking and holding the left mouse button on the left or right margin of the highlighted section, you can extend or narrow the range of data displayed in the chart. If, on the other hand, you click and drag the highlighted area from its center, you can move it to view a different interval but of the same length as the current one.
An alternative method to zoom on the X axis is to use the mouse wheel: positioning the mouse inside the graph and scrolling upwards restricts the range of the displayed data, while scrolling downwards widen. Finally, if you hold down the Ctrl key on the keyboard when using the mouse wheel, the range of displayed data will be reduced or enlarged by keeping the position identified by the mouse on the chart centered.
The right section of the chart contains the Y axes, i.e. the price and value axes of the indicators, one for each panel of the chart. Normally the chart automatically calculates the scale of the Y axes, but it is possible to customize it using the mouse. Moving the mouse over the area of a Y axis, clicking and holding the left mouse button, moving the mouse up or down, the scale will be scaled to lower or higher values respectively. If, on the contrary, you position the mouse inside the axis area and use the mouse wheel, rotating it up or down will extend or reduce the axis scale.
When the scale of a Y axis is changed with the mouse as described above, an “Auto” button will appear in the lower margin of the axis which, if clicked, will restore the automatic calculation of the panel’s Y scale.
Organize by Groups
The “Grouping” function allows you to combine different charts into a single group using up to 8 different groups, each identified by a different color. Once the different charts are grouped, it is possible to make changes (symbol, timeframe, indicators, or loading templates) simultaneously on all the charts of the same group.
Group selection is made using the appropriate box in the selection commands menu. When the chart is part of a group, clicking on the setting icon immediately to the right of the group selection box opens the group properties window.

