
OverSpread Scanner
Understand the OverSpread Scanner function
OverSpred Scanner is the OverSpread function to perform the first sorting of pairs. In this window all the pairs deriving from the assets previously chosen are collected. From the menu there are some useful functions such as filters or the selection of the properties displayed.

- Add Manual Pair: adds a pair consisting of two assets chosen by the user;
- Views: opens the graphs related to the selected pair;
- Details: opens a window that displays all the properties of the selected pair;
- Refresh: update the asset data contained in the OverSpread Scanner;
- Send to OS Watchlist: sends the selected pair in the OverSpread Watchlist;
- Properties: launch the Choose Properties window to choose which properties view, save the layout of the properties or upload a previously saved one;
- Filters: launch the OverSpread Scanner Filters window to set filters to reduce the pairs in the scanner, the filters set can be saved and loaded in the future;
- Assets: opens the chart for asset A, asset B or both.
Filters
It is very likely that at the end of the scan there are many pairs in OverSpread Scanner. Using filters is the best way to limit pairs to those that can actually be used to do an OverSpread.
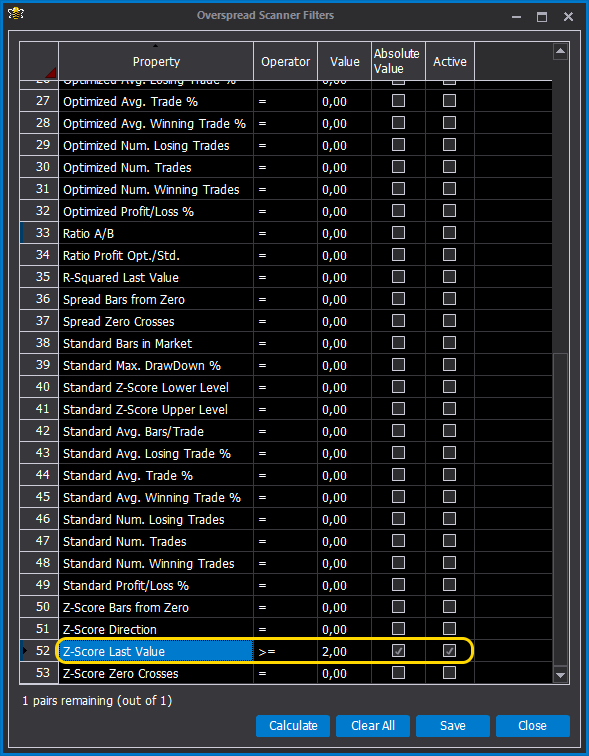
The purpose of the OverSpread Filters function is to apply different filters and to restrict the pairs present in the OverSpread Scanner. For each property that you want to use as a filter you choose the mathematical operator, the value, if this value is to be considered in absolute value and finally the filter activated. Clicking on Calculate beeTrader filters the pairs based on the set values.
In the example it has been set that the value of Z-Score Last Value must be greater than or equal to 2 in absolute value. In this way all the pairs that are greater than 2 Z-Score and less than -2 scores are identified, just the ones that interest us.
Properties Legend
| Asset A Indexed Price | Indexed value of the asset A. The first value of the asset A is set to 100%, all subsequent values are calculated starting from this value | ||
| Asset A Last Bar Time | Last bar of the Asset A on which the calculations are made, must coincide with Asset B Last Bar Time | ||
| Asset A Last Price | Last price of Asset A | ||
| Asset A Start Date | First useful date of historical data of Asset A | ||
| Asset A UnRealized P/L % | is the Un-Realized Profit/Loss on Asset A open position, in percentage of the investment amount | ||
| Asset A Weight | Weight of the symbols to match the pair. The value of 1 unit is assigned to the asset with the least weight. It takes into account the point value and the price difference | ||
| Asset A Z-Score Last Value | Last value of the Z-Score of Asset A | ||
| Asset B Indexed Price | Indexed value of the Asset B. The first value of the Asset B is set to 100%, all subsequent values are calculated starting from this value | ||
| Asset B Last Bar Time | Last bar of the Asset B on which the calculations are made, must coincide with Asset A Last Bar Time | ||
| Asset B Last Price | Last price of the Asset B | ||
| Asset B Start Date | First useful date of historical data of the Asset B | ||
| Asset B UnRealized P/L % | is the Un-Realized Profit/Loss on Asset B open position, in percentage of the investment amount | ||
| Asset B Weight | Weight of the symbols to match the pair. The value of 1 unit is assigned to the asset with the least weight. It takes into account the point value and the price difference | ||
| Asset B Z-Score Last Value | Last value of the Z-Score of the Asset B | ||
| Average Spread Crossing Interval | The average in bars between a return to zero and the next of the Spread. The lower the number, the less time it will take to close the spread on average | ||
| Average Z-Score Crossing Interval | The average in bars between a return to zero and the next one of the Z-Score. The lower the number, the less time it will take to close the spread on average | ||
| Cointegration | Value that does not exceed unity and that is greater and greater is the bond we seek within the couple | ||
| Confidence Level | Quality, robustness, of the bond found in the cointegration. Higher percentage value and the higher the quality | ||
| Estimated bars to Zero | Estimated calculation of bars that will be needed at the spread to return to zero. The smaller the number, the sooner the pair will be closed in profit | ||
| Historical Bars | Number of bars on which all counts are made | ||
| Max Spread Divergence % | The maximum divergence value that the two assets that make up the spread had. The greater the number, the greater the amount of possible gain | ||
| Max. Z-Score (Final bars) | The maximum positive value assumed by the Z-Score in the last 250 bars | ||
| Max. Z-Score Divergence | The maximum divergence value that had the Z-Score calculated for the two assets. The greater the number, the greater the amount of possible gain or loss | ||
| Min. Z-Score (Final bars) | The minimum value taken by the Z-Score in the last 250 bars | ||
| Optimized Avg Bars / Trade | Average number of bars on the market per trade obtained in the optimization and on which all calculations were made | ||
| Optimized Avg Trade % | Relationship between Optimized Profit / Loss% and Optmized Num. Trades | ||
| Optimized Avg. Losing Trade % | Average value of the losses of the only losing trades obtained in the optimization and on which all the calculations have been made | ||
| Optimized Avg. Winning Trade % | Average value of the profit of the only winning trades obtained in the optimization and on which all the calculations have been made | ||
| Optimized Bars in Market | Number of bars in which the pair has remained in the market overall to generate the calculated results | ||
| Optimized Max DrawDown % | Draw-Down expressed in% that would have been obtained in the time considered and at the values of Z-Score Optimized Upper Level, Optimized Lower Level | ||
| Optimized Num. Losing Trades | Number of losing trades obtained in the optimization and on which all the calculations have been made | ||
| Optimized Num. Trades | Number of trades obtained in the optimization and on which all the calculations have been made | ||
| Optimized Num. Winning Trades | Number of winning trades obtained in the optimization and on which all the calculations have been made | ||
| Optimized P/L Std. Dev. | Standard deviation of the profit that would have been obtained in the time considered and to the values of Z-Score Optimized Upper Level, Optimized Lower Level | ||
| Optimized Profit/Loss % | The profit expressed in % that would have been obtained in the time considered and at the values of Z-Score Optimized Upper Level, Optimized Lower Level | ||
| Optimized Z-Score Lower Level | lower level of Z-Score obtained from the optimization and which would have generated the best performance if used to enter the market. If they are very different from the +/- 2 Z-Score levels, the pair does not have an acceptable statistical behavior and should be discarded. | ||
| Optimized Z-Score Upper Level | upper level of Z-Score obtained from the optimization and which would have generated the best performance if used to enter the market. If they are very different from the +/- 2 Z-Score levels, the pair does not have an acceptable statistical behavior and should be discarded. | ||
| R-Squared Last Value | Last value of R-Squared | ||
| Ratio A/B | Weight ratio between the two titles, coincides with the greater weight to be given to the asset | ||
| Ratio Profit Opt./Std. | Relationship between Optimized Profit / Loss% and Standard Profit / Loss% | ||
| Spread Bars from zero | Number of bars elapsed since the spread has last crossed zero | ||
| Spread Zero-Crosses | How many times the spread crossed zero in the period expressed by Historical Bars. A higher number indicates better spread responsiveness. If the spread crosses the zero line it means that the assets have crossed and therefore any assumed position has gone to 0 | ||
| Standard Avg Bars / Trade | Average number of bars on the market per trade obtained using +2 and -2 as thresholds on the Z-Score to enter the market | ||
| Standard Avg Trade % | Relationship between Standard Profit / Loss% and Standard Num. Trades | ||
| Standard Avg. Losing Trade % | Average loss value of the only lost trades obtained using +2 and -2 as thresholds on the Z-Score to enter the market | ||
| Standard Avg. Winning Trade % | Average value of the profit of the only winning trades obtained using +2 and -2 as thresholds on the Z-Score to enter the market | ||
| Standard Bars in Market | Number of bars in which the pair remained in the market overall, using +2 and -2 as thresholds on the Z-Score to enter the market | ||
| Standard Max. DrawDown % | Draw-Down expressed in% that would have been obtained in the time considered and at the values of Z-Score +2 and -2 | ||
| Standard Num. Losing Trades | Number of losing trades obtained using +2 and -2 as thresholds on the Z-Score to enter the market | ||
| Standard Num. Trades | Number of trades obtained using +2 and -2 as thresholds on the Z-Score to enter the market | ||
| Standard Num. Winning Trades | Number of winning trades obtained obtained using +2 and -2 as thresholds on the Z-Score to enter the market | ||
| Standard P/L Std. Dev. | Standard deviation of the profit that would have been obtained in the time considered using +2 and -2 as thresholds on the Z-Score to enter the market | ||
| Standard Profit/Loss % | the profit expressed in% that would have been obtained over the time considered and at the values of Z-Score Standard. This value must be compared with the Optimized Profit / Loss and must be as similar as possible. | ||
| Standard Z-Score Lower Level | Always equal to -2 | ||
| Standard Z-Score Upper Level | Always equal to +2 | ||
| Total UnRealized P/L % | is the total Un-Realized Profit/Loss of open positions, in percentage of the investment amount | ||
| Z-Score Bars from Zero | Number of bars elapsed since the Z-Score has last crossed zero | ||
| Z-Score Direction | Current direction of Z-Score Last Value, can be UP or DOWN | ||
| Z-Score Last Value | Value of the Z-Score of the spread at the time of scanning. It is colored in absolute value and the greater value indicates the possibility of being close to 2 or -2 which are the standard values for putting the spread on the market | ||
| Z-Score Std. Dev. | Standard deviation of the Z-Score | ||
| Z-Score Zero Crosses | How many times the Z-Score has crossed zero in the period expressed by Historical Bars. A higher number indicates better responsiveness of the Z-Score. If the Z-Score crosses the zero line it means that the assets have crossed and therefore any assumed position has gone to 0 |