Options Strategy – Comparison
Video Tutorial
Understand the comparison function
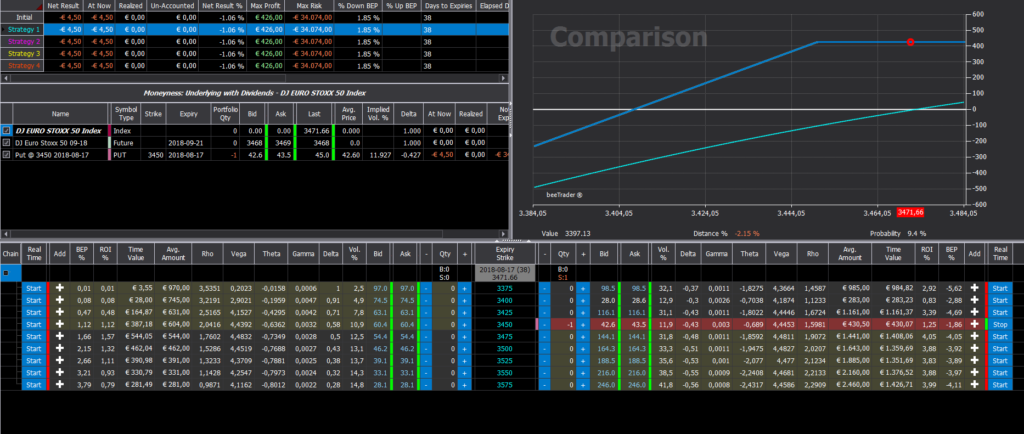
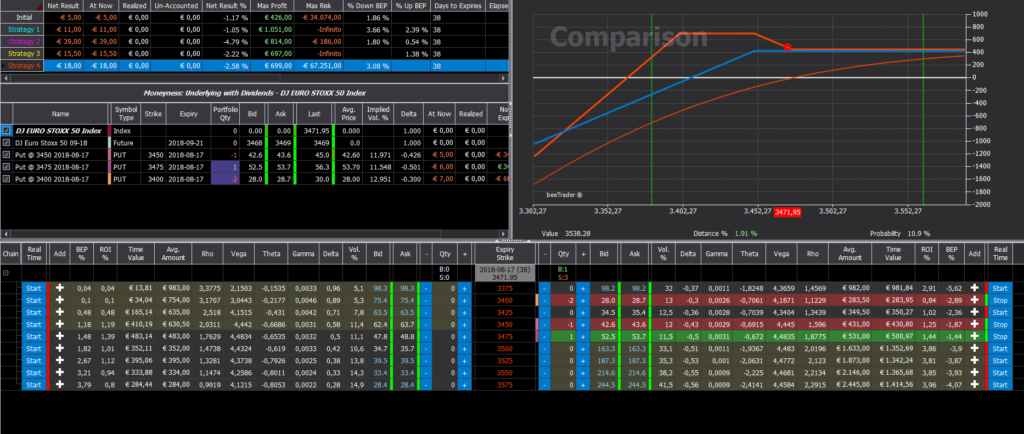
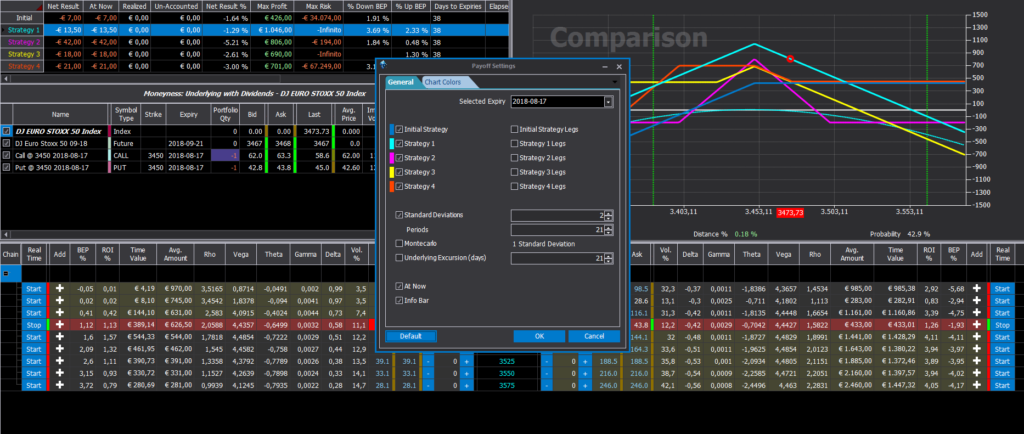
The Comparison function can be used both to choose the best strategy to put on the market and to identify the best corrective move, offers the possibility to study up to four changes to the starting strategy and compare them together in order to understand which is the best with unique parameters such as maximum risk, distance from breakeven, etc.
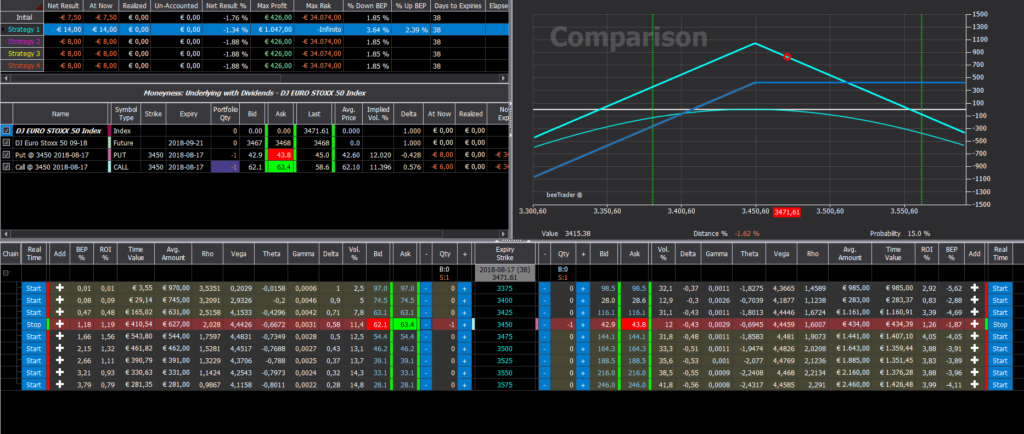
We click on Strategy 1 (light blue) and the strikes of the options chain are colored with the same color, a sign that the operations that we are going to simulate will produce a payoff also of blue color. For example, we correct the strategy by simulating the sale of 1 call always 3450. The payoff goes from the initial to the blue one.
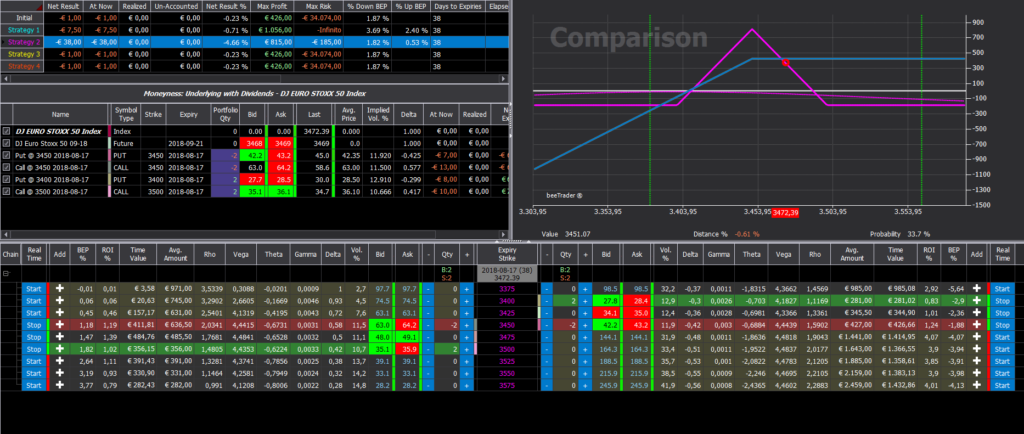
In the same way we click on Strategy 2 and the reference color becomes fuchsia. Let’s simulate the construction of a butterfly. The purple color payoff allows comparison with the initial one.
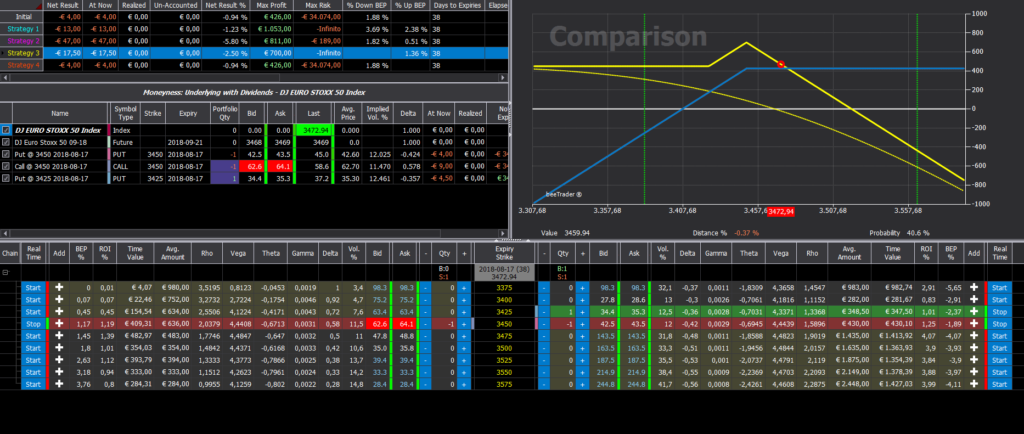
Now on yellow Strategy 3 we simulate the purchase of 1 put srike 3425 funded by 1 call strike 3450. The yellow payoff shows the strategy and can be compared with the starting one.
On Strategy 4 we simulate a castling operation, and through the brick-colored payoff we can, as seen before, compare the current strategy with the starting one.


