
DPD – Defense Point Distribution
Video Tutorial
beeTrader – Defense Point Distribution
Open interests are outdated, the D.P.D. represent the only real big news in the world of finance for several years now. Through the processing of all the underlying exchanges and options, a complex system of calculation algorithms identifies the positions and premiums collected, splits synthetic positions from actual ones and beeTrader therefore shows the user a finished histogram chart that does not require interpretation. This processing requires the historical data of the underlying which will then be requested by beeTrader from the connected broker.
Note: In order that the D.P.D. work properly it is necessary that the asset being analyzed has encoded in Symbol Manager the Chain Options. Assets with Chain Options are written in blue for immediate identification. For the procedure for coding financial instruments in beeTrader, see the specific broker’s page in Data Provider .
Premise: Open Interest vs DPD
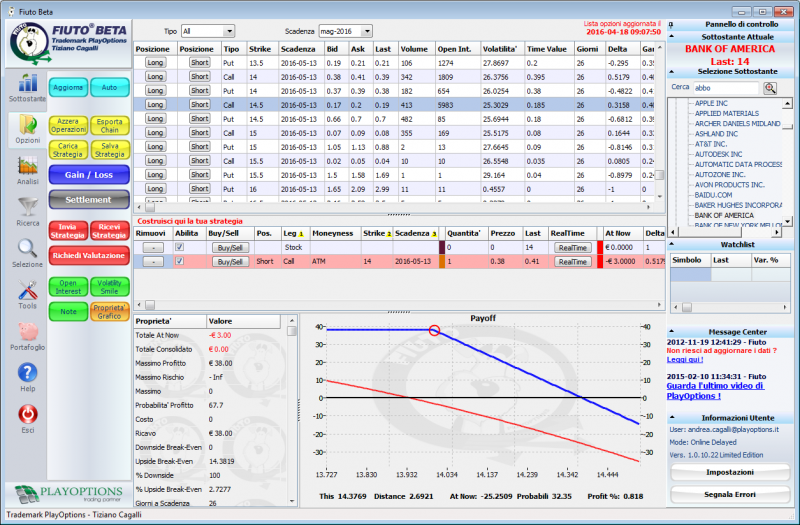
The free software will be used for this press Fiuto Beta.
The market takes position through the derivative contracts of Option whose “existing” number, ie open contracts, is held by the margin and clearing fund which the counterparties of each contract must guarantee. It follows that for each Call or Put contract, both counterparties are satisfied, or the one who bought it will have the counterparty that sold it.
From this it can be deduced that in this way, by simply evaluating this number of contracts, one has the first idea of taking a stand, of expectation, of “strong hands”. In other words, you will see if there is more or less interest in Call contracts or Put contracts.

Now I have the graphical representation that is clear, in green the number and the position of the Put, in Blue the number and the position of the Call. It is now a question of interpreting why the market has placed itself on those strikes and with those contracts. To do this I must identify myself with the strategist who has in fact taken those positions and made some initial considerations … It is true that every bar represents the number of contracts open and it is true that each bar is representative of who bought it and who sold it. Buyers and sellers are in equal numbers and then if we do not do a further reasoning, we know how many contracts there are, there is no indication. What will the buyer do if his contract is not in the direction he expected? Nothing! He will do nothing because, having no obligation, I remember he is a buyer, he has already spent and will only be a wait. Instead, the seller will act on the market in two ways, will be able to enter the underlying asset to reject the trend that would make ITM go its Option, or it will be covered, in practice he will store what the sold contract will oblige it to deliver. Also in this case it will intervene on the market of the subs and modify the courses.
Therefore, contrary to what is read in the literature, the number of option contracts must be considered as contracts sold, or if the number of calls is higher than the number of Put means that the market expects a descent. The reason for the error of interpretation that can be read in the texts is quickly explained: they are texts written some years ago and never corrected, years in which, still, the sale of the options was not allowed, but only the purchase.
At this point we can count on the number of contracts, the type and the strike on which they are placed. Here we have the supports and the resistances that are the real supports and the real resistances of the market. The buyer of the option contract will never intervene on the market by diverting the trend, while the seller must, depending on whether it is Call or Put, intervene on the underlying to be able to hedge. This is why we must consider open interest, so we call the number of open contracts, as a sold part. At each level of Open Interest there will therefore be a defense of the strike sold more or less intense depending on the strength that the seller has and that derives from the collected premium. Another aspect that must be known is whether the contract that you see is “true” or is concise.
Let’s look at an example with a Call:
I sell 1 call for which the open interest increases by 1. Who reads it will think down market.
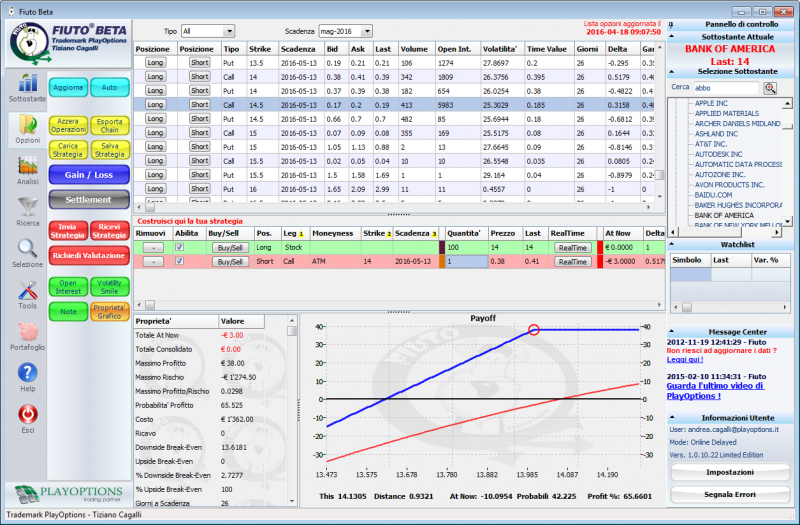
I sell 1 Call and at the same time I buy 1 future and here is where my position synthetically becomes a Put.
Practically, what you want to show with these lines is that reading Open Interest as it is explained in common literature is NOT good for anything.
The need is therefore a tool in real time and with a single, non-interpretative answer. The solution came with beeTrader which, through the options module, allows for real-time data and the indispensable subdivisions between true and synthetic positions.
Thus was born the first histogram in the world that takes into account all these factors: the Defense points Distribution, or the map of defense positions that will be the supports and resistances in the path of the underlying trend.
For each exchange of Futures we take into account all the exchanges in the Chain of options and with our algorithms we can identify both the position and the premium received. We group everything together and represent it as a histogram that, at this point, should not be interpreted, but only read.
Understanding the DPD function

As you can see the image of the DPD is completely different from that of the Open Interest, just to show that the system has been exceeded several years ago and those who continue to follow it or explain it are making a colossal mistake: they forget the sellers!
Let’s do an analysis on the Bank Of America title by reading the DPDs:
Bullish trend that can be seen from the numerous orange columns (Put), with a weak resistance at the first Call level (gray column at 29.16) which grows at the second Call level (29.26) and also at the third (30.02). The resistance they offer will be weak as the relative strength, the money they have to spend, is at a lower level than the Put sellers.
There are no doubts or interpretations, today the strategy that must be done on this title is bullish and the strikes involved in the strategy must take into account the movement of the lower price between 28.84 and 30.02.
Note that the D.P.D. they no longer coincide with the exact strike like Open Interest but incorporate the prize that shifts the moment of intervention in defense. The strike 28 will be defended at 28.84 because the prize collected at the time of the sale was an average value of 28.84 – 28.00 = 0.84.
Example
The system of D.P.D. is based on the Relative Strength, or rather on the relative strength that is opposed to exceeding of the price level indicated by the asset. For ease of interpretation three horizontal lines representing strength levels are represented.

In the example below, we note that there is a resistance to the descent to altitude of 21,129.03, confirmed by an even stronger one at 20870.78, while uphill there is a low relative strength support at 21628.03, while a stronger one is as always less than the downhill one at 22144.53.
The Refresh button
update the DPD with new data, it is possible to do a Refresh every hour. Clicking on the “Refresh” button, if an hour has not passed since the last update, a window appears warning you of the remaining time.
The Strike Step
setting to be used only for indexes, it is used to visualize the operations of large movers by incorporating those of small traders who also work on intermediate strikes present on weekly expiries that are not used by the institutional.
In the setting of the strike step one must not exceed the interval between strikes found in the first monthly deadline.
Example: FTSE MIB weekly strike price = 100, first monthly strike price = 250, annual strike price = 500. Filter to use = 250
Entries legend
- Total Strength: sum of the relative forces divided into Call and Put
- Avg. Strength: relative strength divided into Call and Put
- Num Levels: number of Call and Put levels with a relative strength greater than Low Strength
- 1st Low: first level starting from the price of the asset with a relative strength greater than Low Strength
- 1st Norm: first level starting from the price of the asset with a relative strength greater than Normal Strength
- 1st High: first level starting from the asset price with a higher relative strength than High Strength
- 1st Low%:% distance compared to the 1st Low asset price
- 1st Norm%:% distance from the asset price of the 1st Norm
- 1st High%:% distance compared to the 1st High asset price
- Highest Level: value of the maximum relative strength divided into Call and Put
- 21628.03 level: price of the first resistance call (relative to the example)
- 21886.28 level: price of the second resistance Call (relative to the example)
- 22144.53 level: price of the third resistance Call (relative to the example)
- …
- x level …: the number of Call resistances and their value are strictly related to the financial instrument and market conditions
- 21129.03 level: price of the first Put support (relative to the example)
- 20870.78 level: price of the second Put support (relative to the example)
- 20612.53 level: price of the third Put support (relative to the example)
- …
- x level …: the number of Put supports and their value are strictly related to the financial instrument and market conditions