
Options Portfolio – Legs
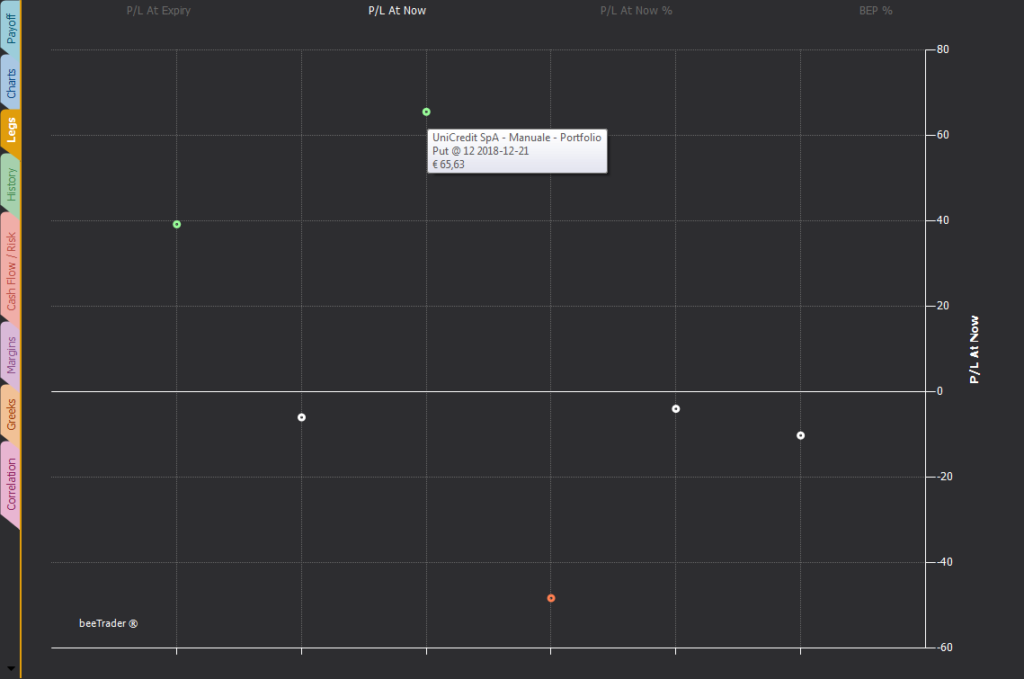
This graph shows the legs in the form of dots that are colored red or green if they are beyond a standard deviation from the average. This type of visualization allows at a glance to have a complete view of the legs of the strategies that make up the user’s wallet.
In the upper part of the graph it is possible to choose on the basis of which parameters to see the legs: P / L at maturity, P / L at now, P / L at now%, Bep%.
These choices allow the user to view the portfolio graphically based on the most important parameters.