
Imbalance
Video tutorial
Real time trading with the IMBALANCE
The Imbalance Chart
The Imbalance chart is similar to the Footprint one: it also uses the trading volumes to visualize situations of Imbalance, i.e. there is no balance between the volumes of buyers and sellers.
Let’s see how the trader can manage this phenomenon which is often perceived as a good new trading opportunity, so here’s how it is calculated.


The algorithm shows the traded volume from bid and ask at certain price levels for each bar of the chart, compares bid and ask diagonally (in both directions) and highlights in blue a significant excess of one over the other.
The bar in the image shows how the sellers entered the market out of balance with the buyers and pushed the price down.
In the image on the side, the algorithm marks the first box in blue because the current setting is:
volumes with a greater difference> 200% by comparing Bid and Ask in two different adjacent price levels.
The calculation is done in both directions, i.e. volume 2 with volume 25 (2/25 = 0.4 * 100 = 40%) and volume 25 with volume 2 (1250%).
Since in the box shown the volume 25 has a result greater than 200% (our minimum activation level with the current settings), it is highlighted in blue.
Ecco un primo Squilibrio!

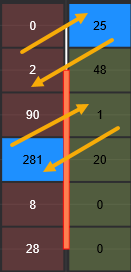
The same procedure was performed for box 281 and box 1. In fact 281/1 * 100 = (281%) while 1/281 * 100 = (0.3%). And since we have set to highlight imbalances greater than 200%, box 281 is colored blue.
This is the second Imbalance, which however is not a support / resistance level as we have set by default to consider support / resistance, only in the case of 3 adjacent Imbalances in 1 single bar.
The Imbalance can be managed by changing the calculation settings by acting in the appropriate window.
An optimal size of the imbalance depends on which tools and with what time frame you are using. As a general rule, 300% is a good place to start.
In the properties window the available settings are as follows:
- Imbalance Ratio: the percentage you want to intercept by comparing the Bid and Ask volumes in two different adjacent price levels;
- Ticks Grouping: the number of ticks that make up a price level in candles;
- Show Support/Resistence*: aactivate to view support and resistance areas;
- S/R Imbalance Count*: how many adjacent Imbalances there must be before drawing a support or resistance;
- S/R Length: allows you to choose how to display the support / resistance line in one of three ways:
- Chart End: lthe S / R line will be drawn up to the right edge of the graph, and will always be present even in case of generation of new S / R lines;
- Next S/R: this choice allows you to view the S / R line only until a new S / R line is generated;
- Fixed number of Bars: each S / R line has the same length, which can be changed by setting the value in the “S / R Length in Bars” field.
- Sell Color**:the color of the column with the volumes traded on Bid;
- Buy Color**: the color of the column with the volumes traded on Ask;
- Imbalance Color: color with which to highlight the conditions of Imbalance and draw the areas of support and resistance;
Note * – One or more Imbalance boxes may appear in a graph. When this happens it means that the sellers and buyers are fighting and the strongest will win. The higher the Imbalance number, the more effective the S / R will be.
Note ** – This might seem counterintuitive, but one has to think about the effect a Trader produces when they take action to buy. It will continue to fulfill contracts that are on the Ask side. These contracts will mark the contracts bought on Ask (which they want to sell). And viceversa.

In the image on the side you can see how after 3 Imbalance the Resistance line was drawn in the same bar. In fact, the price takes the path of descent.
Then, in the bar relating to point 2, 3 more Imbalances took place. This also formed with the price below the line and thus provided an additional Short signal.
At point 3 new Imbalance, this time with Long signal.
If we had performed the 3 signals Short, Short and Long with a Trading System we would have earned 30 points !!
It is interesting to note that however these IMBALANCES formed, they act as very important supports or resistances.
In fast operation they can be used as a signal according to the rules:
- Imbalance on Bid: resistance;
- Imbalance on Ask: support.
If the price will go in the opposite direction, the position can be hedged to a second Imbalance, perhaps using the standard deviations to better understand the situation.
