Volatility Finder
Video Tutorial
Understanding the Volatility Finder function
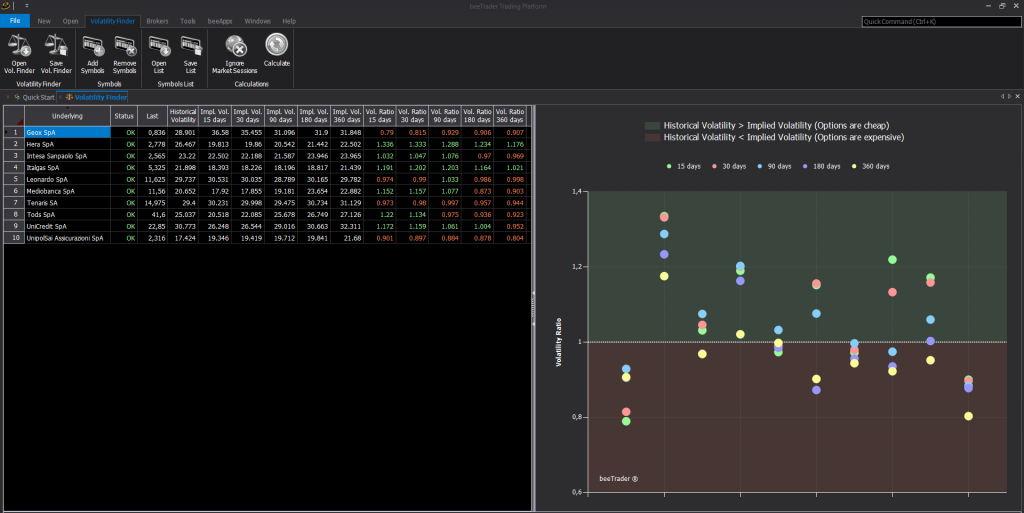
Volatility Finder is a very useful feature when searching for underlying assets to operate on, as it allows you to immediately compare the historical and implied volatilities of different underlying assets at the same time.
The use of this function is very simple, as it is only a question of selecting a series of assets and letting beeTrader perform the calculations.
In addition to the numerical values of the volatilities, on the right side of the window there is a graph that immediately highlights which assets have:
- Historical Volatility greater than the Implied Volatility = GREEN colored area (in these cases the purchase of the Options can be advantageous because they are quoted at a price lower than that foreseen by the historical volatility);
- Historical Volatility lower than the Implied Volatility = RED colored area (in these cases the sale of the Options can be advantageous because they are quoted at a price higher than that foreseen by the historical volatility).
For each underlying asset, the implied volatilities at various rolling maturities are calculated, in order to provide an overview of the relationships between historical volatility and implied volatility over various time horizons.
The interpretation of the graph is very simple:
- All the indicators lying in the green area are congruent with the purchase of the options, because they are quoted at a lower price than forecasted by historical volatility;
- All the indicators lying in the red area are congruent with the sale of options, because they are quoted at a higher price than expected from historical volatility.
Rolling Implied Volatility: this means that it is calculated using the two expiries closest to the chosen number of days, one lower and one higher, and on these two the weighted average of the respective implied volatilities is calculated.
Let’s take some examples. Let’s consider 30 days as the Rolling Implied Volatility period, we can have these scenarios:
- If I have two maturities at 25 and 35 days, the result will be weighted 50% at 25 days and 50% at 35 days, because they are equidistant from 30 days;
- If instead I have two maturities at 10 and 40 days, the result will be weighted at 33% at 10 days and at 67% at 40 days, because the 10-day maturity is 20 days away, while the 40-day one is only 10 days away . The 10-day maturity weight is therefore less than the 40-day maturity weight.
Considering other periods, the reasoning to follow is always the same.
The list of periods is limited to a set of predefined values, which are the maturities on which the volatility surface of the entire options chain is usually calculated.
Commands on the main menu
- Open Vol.Finder: opens a previously saved Volatility Finder, complete with all values already pre-calculated;
- Save Vol.Finder: allows you to save the current Volatility Finder so that it can be opened at a later time, complete with all the calculated values;
- Add Symbols: allows you to add more symbols to the list of those for which you want to calculate volatilities. Multiple selection is allowed;
- Remove Symbols: removes all selected rows from the symbol list. You can also delete selected rows using the Del key on your keyboard;
- Open List: allows you to read a list of symbols from a file, and add them to the list of those for which you want to calculate volatilities;
- Save List: saves the list of symbols to a file which can later be reused;
- Ignore Market Sessions: it is an On/Off setting. When enabled beeTrader will not take into account the times of the options trading sessions. When disabled beeTrader will not calculate the implied volatility values for those assets currently not in a regular trading session. This setting can be useful if assets from different markets are used;
- Calcolate: starts the data download of the selected symbols from the respective broker/datafeed and performs the calculations of the historical and implied volatilities.
Note: during the calculation phase several real-time data connections are initiated to receive the updated prices of the symbols and the respective options to calculate their implied volatilities.
The duration of the calculation procedure depends on the characteristics of your broker/datafeed and on the number of symbols selected. The calculation procedure may take several minutes to complete. It is recommended to avoid calculating data on very long symbol lists.
It is possible to interrupt the calculation procedure by clicking on the Cancel button in the center of the window.
Differences between Volatility Index and Volatility Finder:
The beeTrader Volatility Index represents the averaged volatility of the entire surface over all maturities, i.e. all OTM, ATM, ITM options listed on all available expiries, therefore the height of the volatility surface compared to historical volatility.
The Volatility Finder instead analyzes only the implied volatility of ATM options with rolling expiry dates of 15, 30, 90, 180, 360 days.
For those who have not understood the differences between the two studies, let’s say that the Volatility Index provides information on the implicit volatility of the entire options chain and allows you to carry out an analysis of the underlying’s volatility regardless of the expiries, while the Volatility Finder is used to identify on which expiry it is most convenient to buy or sell options .
Volatility Index and Volatility Finder are therefore NOT comparable but complementary!


