
Market Profile
Video Tutorial
The Market Profile chart
The Market Profile offers the possibility to view the price levels and volumes traded for certain time intervals, thus obtaining information on the support or resistance levels that have been created. It will also be possible to evaluate when these levels have been obtained and with how many exchanges, thus also evaluating a measure of “strength”.
The blocks or letters group the prices at which exchanges take place in the time selected by the user. These blocks are called Time Price Opportunities which for convenience we call TPO.
The distribution of prices during the day will contain all the TPOs obtained in the selected timeframe. That is, the distribution chart will have a first block (TPO) with the letter “A” which will correspond to the first price traded. This first TPO will contain all the trades that took place in the selected price range and can be followed by other TPOs with the same letter or color until the time selected in the Settings expires. At the end of this time, new blocks identified by the following letter with a different color will be added to the graph, repeating the same construction until the market closes.
In an 8 hour market if we suppose to set the timeframe to 30 minutes we will have a distribution of blocks or letters which will be respectively: (8 0re / 30 minutes = 16) 16 different colors for 16 letters of the alphabet (from A to P ).
To the right of the letters a red asterisk and the # symbol appear to indicate the Last, which at the close of trading will correspond to the Close.
It is possible to display labeled horizontal lines corresponding to:
-
POC: shows the longest traded price in the current distribution. The value shown is the average of all the prices that make up all the blocks corresponding to the longest row;
-
POC Vol: shows the price at which the largest number of trades took place, not to be confused with the largest number of volumes. It favors 1000 trades of 1 share rather than 1 trade of 1000 shares.
Si possono anche visualizzare delle zone verticali colorate che corrispondono a:
-
Initial Balance: difference of prices in the first two profile letters (the timeframe of the letters can be set);
-
Opening Range: price activity in the first 5 minutes of trading (settable);
-
Value Area: area where 70% of TPOs are concentrated, starting from the POC line;
-
Volume Value Area: area where 70% of the Volume TPOs are concentrated, calculated starting from the POC Vol line;
-
Initial Balance Extension 1-2-3: up to 3 different vertical zones can be selected which represent the Initial Balance histogram increased, in number of letters, by the percentage selected by the user;
-
Custom Lines: allows you to draw lines at set prices and names.
Finally, it is possible to view the histograms of the Volumes to the left or to the right of the price TPO distribution. The histograms of the Volumes are also drawn in blocks, each price TPO block has its corresponding Volume block.
In the Market Profile there is an information panel that shows the characteristics of the TPO blocks where the mouse cursor is positioned. This panel is divided into several sections, separated from each other by a blank line.
First section
- Data e ora of TPO;
- TPO: Number of total TPO blocks in the profile, followed by the number of TPOs above the POC line and the number of TPOs below the POC line;
- TFF: Trade Facilitation Factor, equal to the total number of TPOs divided by the High-Low price range of the profile. The higher the value, the less strong the trend. Profiles normally have high TFF values, and only trading days / weeks with very significant price changes have low TFF values;
- Q%: Open and Close Quadrant. These values are calculated as Open / Range and Close / Range respectively. Range is the High-Low price range of the profile. The values can vary from 0% (when Open or Close are equal to Low) to 100% (when Open or Close are equal to High);
- VAH: Value Area High;
- VAL: Value Area Low;
- POC: Point of Control, which represents the most traded price in the profile, i.e. the row that contains the most blocks;
- RF: Rotation Factor. For each letter in the profile, a value of +1 is calculated if its High is greater than the High of the previous letter, and a -1 if its High is less than the High of the previous letter. Furthermore, a +1 is calculated if its Low is greater than the Low of the previous letter, and a -1 if its Low is less than the Low of the previous letter. The value calculated for each letter, which can vary from -2 to +2, is added to obtain the RF value of the profile;
- VLT: Volatility, calculated as the average price range of the letters that make up the profile;
- RNG: Price range of the profile, equal to High-Low, followed in parentheses by two other values, which represent the height of the profile in blocks and the maximum width of the profile in blocks;
- MID: Average price of the profile, equal to High + Low / 2;
- VOL: Total volume of the profile.
Second section
- P: Price of the TPO on which the mouse cursor is positioned;
- V: Volume associated with the TPO.
Third section
- TPO: Number of blocks / TPO at the price identified by the mouse position, followed in brackets by the TPO number above the price and the TPO number below the price.
Fourth section
- LET: Letter, represents all the letters in the profile equal to the one identified by the position of the mouse. In addition to the letter, the initial date and time of the letter is also displayed, and then the range of the minimum and maximum times represented by the letter itself;
- H: Maximum price of the letter;
- L: Minimum price of the letter;
- V: Total volume of all TPOs associated with the letter;
- RNG: Price range of the letter, equal to High-Low of the letter.
Fifth section
- TPO: Letter and average price of the single TPO identified by the position of the mouse;
- V: Volume associated with the single TPO.

Market Profile chart settings
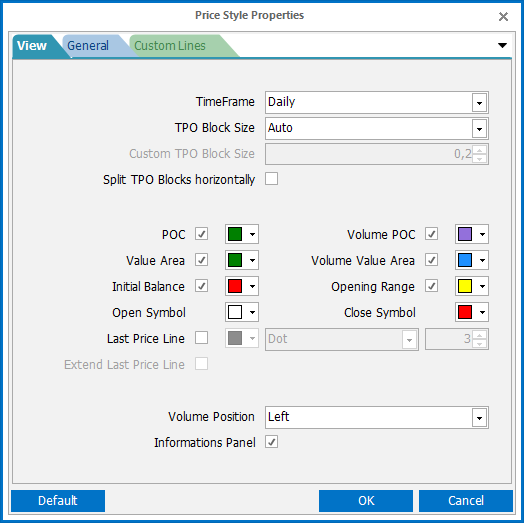
This section of the Market Profile chart settings window contains the main configurations that determine how the data is displayed.
- TimeFrame: grouping of data, the available choices are Daily and Weekly, indicating that each profile represents a day or a week of trading;
- TPO Block Size: size of TPO blocks, the available choices are Auto or Manual, indicating the width on the price axis of each TPO block of the profile. By choosing the Auto setting, the chart automatically calculates the amplitude of the TPO blocks, while by choosing Manual it will be necessary to set the amplitude in the following field;
- Custom TPO Block Size: available only when “TPO Block Size” is set to Manual, it represents the width on the price axis of each TPO block in the chart;
- Split TPO Blocks horizontally: if active, each column of the profile will contain only and exclusively a letter, otherwise the letters in the profile will be positioned in the first free position furthest to the left, making the profiles more similar to a Gaussian distribution;
- POC: enable or disable the drawing of the POC, and choose the color;
- Volume POC: enable or disable the drawing of the POC Volume, and choose the color;
- Value Area: enables or disables the drawing of the Value Area, and chooses the color;
- Volume Value Area: enable or disable the drawing of the Volume Value Area, and choose the color;
- Initial Balance: enable or disable the drawing of the Initial Balance, and choose its color;
- Opening Range: enables or disables the drawing of the Opening Range, and chooses its color;
- Open Symbol: set the color to use to draw the block corresponding to the opening of the profile;
- Close Symbol: set the color to use to draw the block corresponding to the closing of the profile;
- Last Price Line: enables or disables the drawing of the line relating to the Last price, chooses its color, style and thickness;
- Extend Last Price Line: if active, the line relating to the Last price will always use all the available space of the chart on the left side, starting from the Close price symbol of the last profile, while when it is not active the line will stop at the margin of the last TPO block immediately to the left of the Close price symbol of the last profile;
- Volume Position: allows you to choose where to display the TPOs relating to the Volumes. The available choices are Left (draws to the left of the price profiles), Right (draws to the right of the price profiles) and Off (does not draw the TPOs of the volumes);
- Informations Panel: enables or disables the drawing of the information panel relative to the position of the mouse pointer.
In this section of the settings window there are some less common parameters related to a more in-depth customization of the chart design.
- Minutes per Letter: indicates the duration of each letter of the profiles;
- First Letter Time: indicates the duration of the first letter of the profiles;
- First Letter: allows you to choose which letter sequence to use to draw the profiles;
- Color for All Letters/Blocks: if active, it sets a single color to be used for all the letters of the profiles, otherwise the profiles will have a different color for each letter;
- Draw Blocks only: always and only draws blocks, without highlighting the relative letters within the blocks themselves;
- Initial Balance Extension 1-2-3: activates or deactivates the extension 1, 2, or 3 of the Initial Balance, and allows you to set the color and how many letters to add to the Initial Balance, expressed as a percentage (example: if Initial Balance includes the 2 letters A and B, by setting 200% the extension will include the 4 letters A, B, C and D);
- Show I.B. Extensions Labels: if active, it shows texts for each of the extensions of the Initial Balance active on the chart;
- Opening Range: duration of the Opening Range of profiles.


In the last section of the setup window it is possible to choose which custom lines to add to the chart and how to draw them. The lines can be added or removed using the grid at the top of the card, while the way to draw them can be customized at the bottom of the card;
- Enable: on the lines grid, it determines whether the corresponding line is active or off;
- Text: on the lines grid, set which text to show next to the corresponding line on the chart;
- Price: on the grid of the lines, set at what price to draw the corresponding line;
- Show Custom Lines: se attivo, abilita il disegno delle linee personalizzate, se spento non verrà disegnata alcuna linea personalizzata, anche se presente ed attiva nella griglia delle linee;
- Show Custom Lines Labels: if active, it enables the drawing of custom lines, if off no custom line will be drawn, even if present and active in the lines grid;
- Show Custom Lines Prices: if active, the price of each custom line will be shown next to it on the chart;
- Custom Lines Color: choose which color to use to draw custom lines on the chart.