
Volume Overlays
Real-Time

This indicator shows the volumes in real-time tick by tick. Each tick has its own column with the total volume of traded contracts. The highest volume is highlighted in a different color.

In the settings window it is possible to choose the different colors and on which side of the chart to display the volume histograms.
Time Range Volume
This indicator shows the volume of contracts traded in the specified time frame. Each column shows the total volume of traded contracts and the highest volume in the range is highlighted in a different color.
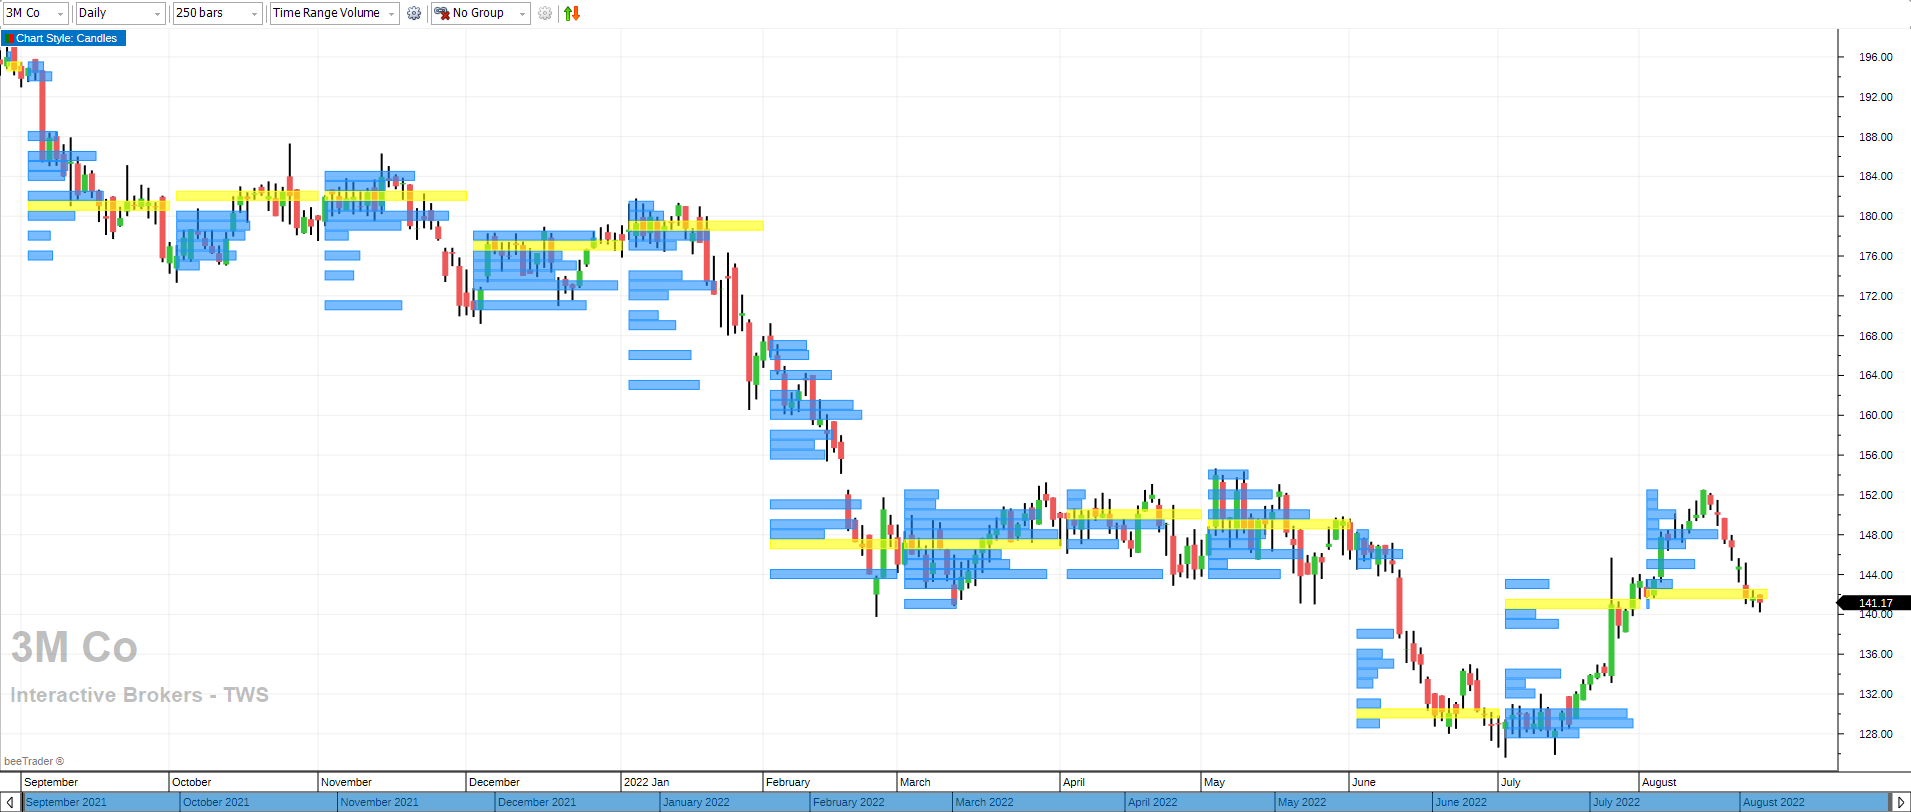
In the settings it is possible to choose different colors, time range and how many ticks must be included in each histogram, chenging the number of ATR (Average True Range) you want to group.

Volume by Price

This indicator shows the total volume of traded contracts, counting both historical and real-time ones. Contracts are grouped by price and by Buy or Sell direction. Buy volumes are displayed in green while Sell volumes are displayed in red. The quantity is displayed within the columns.

In the setting window it is possible to select on which side of the chart to draw the indicator, how to color the bars and how many price ticks will form each column.
No Volume Overlay
This choice removes the Volume Overlays from the chart.