Open Interest
beeTrader and Open Interest, where institutionals have placed their pillars.
What is Open Interest?
Simply the set of open contracts, that is, still outstanding, on Call and Put options diversified by Strike and by maturity.
We know that to make any contract you need the party who buys but also the party who sells. When this agreement is signed, 1 new contract is added to the others and will be positioned on the series, on the strike and on the expiry with which this contract has been agreed.
So there is a bullish side and a bearish counterpart in every contract in both the series Call and the series Put . What we therefore need to know in order to give us some indications is that Open Interest contracts must always be considered as SOLD contracts.
Not because there are no buyers who obviously are equal in number to the sellers, but because only the sellers will come in defense of the strike that will not have to go ITM. How will they do it since they want to save their prize? Either by rolling the position, that is, by closing the contract and reopening it on a more distant strike, or with large amounts of money they could change the trend of the underlying.
That’s why there are supports and resistances! Precisely because strikes are defended!
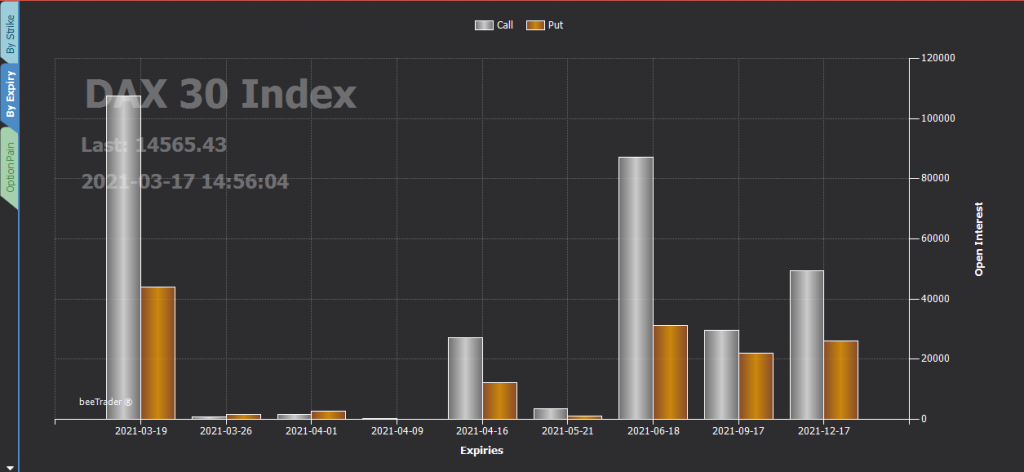
It is also used to understand the underlying trend: if on the end expiration you can see that there are more Calls than Put, it can be assumed that the underlying trend expected by investors is BEARISH given that the Calls we consider them sold. NEUTRAL if the quantities are similar and BULLISH , if there are more PUT contracts than Call contracts.
Analyzing Open Interest for indices have a greater value than for the single stocks, even if the stocks that make up the indices are sufficiently traded.
Open Interest Instructions
The Open Interest values can be downloaded or updated in two ways, by clicking with the right mouse button on the chart and choosing the Update menu or by downloading the volatility surfaces.
Open Interest provides insight into how big investors have positioned themselves, and knowing they won’t want to go ITM, you can do your own trend analysis.
It is possible to draw the Open Interest overlayed on the historical chart of the underlying in the Vertical chart, using the right mouse button to activate or deactivate it, and see how the Open Interest strikes have worked as supports and resistances.
The available views are: by strike, by expiry and Option Pain.
By Strike
When selecting the view by strike, the chart shows the Open Interest values grouped by strike. At the bottom of the chart you can choose which data to display. If you choose “All Expiries”, the displayed values are the sum of the Open Interest of all available expiries that were selected by the user when updating the data. By choosing a specific maturity, the displayed values are relative to the selected maturity only.
By Expiry
When selecting the view by expiration, the chart shows the Open Interest values grouped by expiration, summing the values of all available strikes that were selected by the user during the data update.
Option Pain
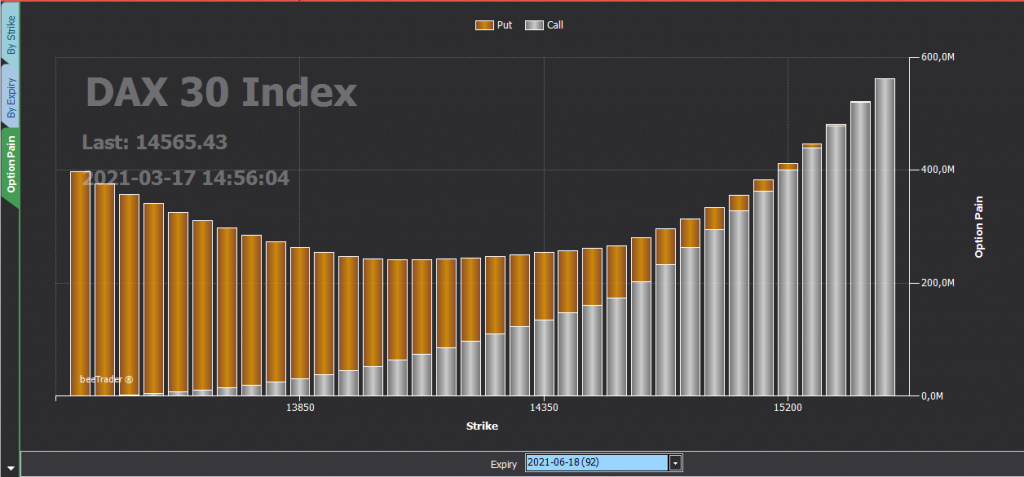
A last view is given by the Option Pain window which calculates the point where the underlying (for the selected expiry), would cause less “Pain”, ie less damage for the sellers. So it’s a great FORECAST indicator that tells us where the underlying might move on the selected date.
Put Call Ratio
Clicking on the tab Put/call Ratio, it is possible to view the P/C Ratio values for each expiry.
The Put/Call Ratio is the ratio between the Open Interest of the Put options and that of the Call options. In this case, the literature considers those who have bought the contracts present in the open interest as market players instead of the sellers.
A value greater than 1 indicates a mayor number of Put options than Call options and may indicate a bearish trend; on the contrary, a Ratio lower than 1 may indicate an uptrend.
For stock options, as more Call than Put contracts are statistically traded, as a trader can prefere to have a long potision on the stocks, a threshold value of 0.7 is usually considered instead of 1 to indicate the direction of the trend.
Note
At the moment this function is NOT available for Fideuram, as this service do not provide Open Interest data, while it is on all other brokers, including Deribit which provides them on Bitcoin and Ethereum.


