Footprint
Video Tutorial
Trade the volumes: the Footprint
Il grafico Footprint
Footprint is the imprint that the volumes give to the market.
By analyzing the actions of buyers and sellers, the trader can identify a direction of the market. Keep in mind that volume analysis is a fairly recent method to view asset graphs, in fact, it was introduced only 20 years ago and is the only real indicator that has a zero delay in the calculation.
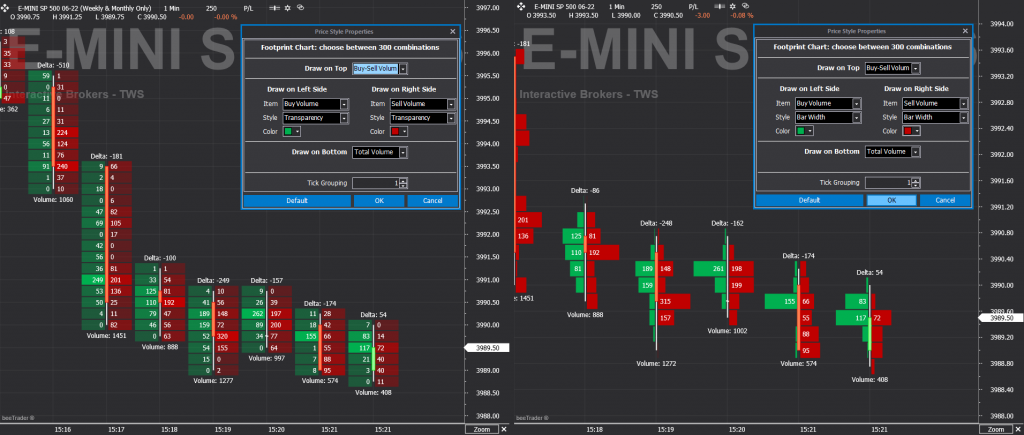
The Footprint chart can be configured in 300 different combinations, so it can be adapted to the needs of any trader.
By clicking on the Footprint choice, a window will appear that allows you to view 5 graphic themes set by default.
- Basic: visualize the volumes of purchase and sale with the same color using transparency, more opacity means higher volumes, more transparency means lower volumes;
- Buy/Sell: visualize the volumes of purchase and sale with two different colors using transparency, more opacity means higher volumes, more transparency means lower volumes;
- Buy/Sell Bar Width: displays buy and sell volumes in two different colors using the length of the bars to represent volumes, longer bars indicate larger volumes, shorter bars indicate smaller volumes;
- Advanced: as Buy / Sell, but also shows the Delta, that is the difference between the volumes in purchase and sale, in the upper part of the candles, and the total volume in the lower part of the candles, both displayed as simple texts;
- Advanced Bar Width: like Buy / Sell Bar Width, but it also shows the Delta, i.e. the difference between the buying and selling volumes, at the top of the candles, and the total volume at the bottom of the candles, both displayed as simple texts.
By clicking on one of these choices, the graph will be set as shown in the relative previews. The last button allows you to access the customized configuration of the graph.
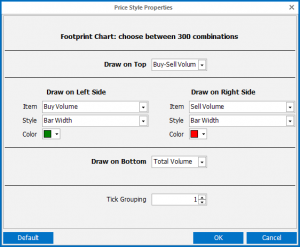
The image alongside shows the settings window and, as you can see, it is very intuitive. Given the large amount of combinations available, we strongly recommend that you practice to find the best choices.
In case you get lost in the various changes, you can always go back to the standard starting combination by clicking on the “Default” button.


