
OverSpread
Video Tutorial
Understand the OverSpread function
The use of OverSpread consists of some passages that will be summarized below, and then deepened in specific sections of the manual.
Requires 1200 history bar in the timeframe used
Start a scan
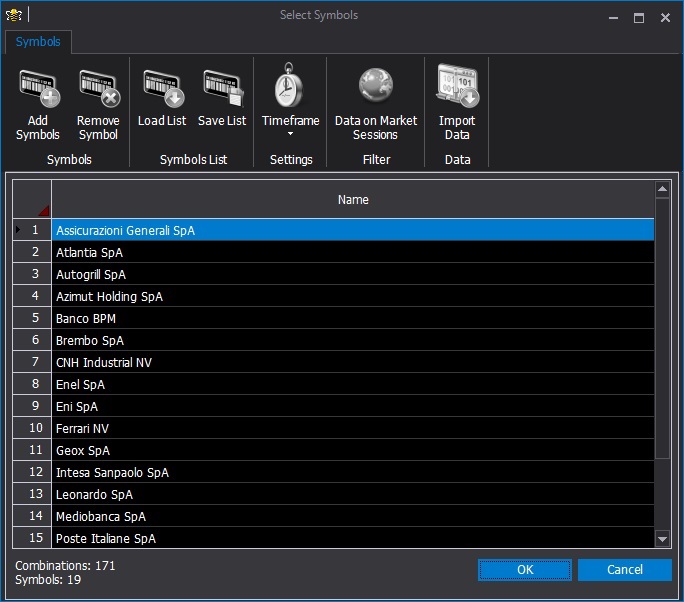
The first thing to do is to start scanning the titles. From the New menu – & gt; OverSpread Scanner opens the Select Symbols window.
Here you need to add the assets you want to scan (Add Symbols) or the asset lists (Load List). It is advisable to have the assets that are of interest in a list in order to speed up the procedure for future uses. To do this there is the Save List button and in any case once clicked ok it asks if you want to save the list.
Then the timeframe is chosen. If you are using the OverSpread with options it is advised not to go below the hourly timeframe.
Data on Market Session if activated it filters the historical data requested to the broker according to the market to which each asset belongs, it can be used for example if the broker also provides historical after hour data. While Import Data, once the asset has been selected, offers the possibility of importing historical data in * .beehist format (saved with beeTrader) and then integrating those in possession.
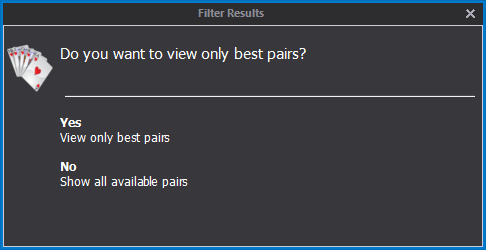
At the end of the scan beeTrader asks whether to display all the pairs, or only better ones. The best ones are obtained by applying the filter
Cointegration >= 0.6
Historical Bars >= 1300
Ratio Profit Opt./Std. <= 1.5
Standard Profit / Loss% > = 10
Z-Score Last Value >= 2.0 (absolute value)
The scan results
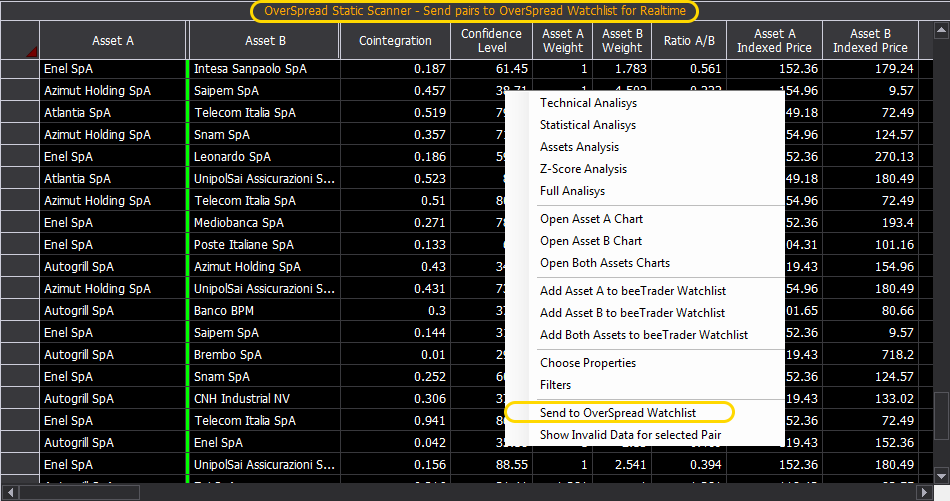
At the end of the download of the historical data and the calculations (which will require the greater the quantity of the assets to be evaluated) the pairs are displayed in the OverSpread Scanner which is not updated as shown at the top of the window, it is static. For more information on OverSpread Scanner and all features, click here.
At this point we identify, based on our own evaluations, the pairs that interest and are sent to OverSpread Watchlist in this way the data will be updated at regular intervals.
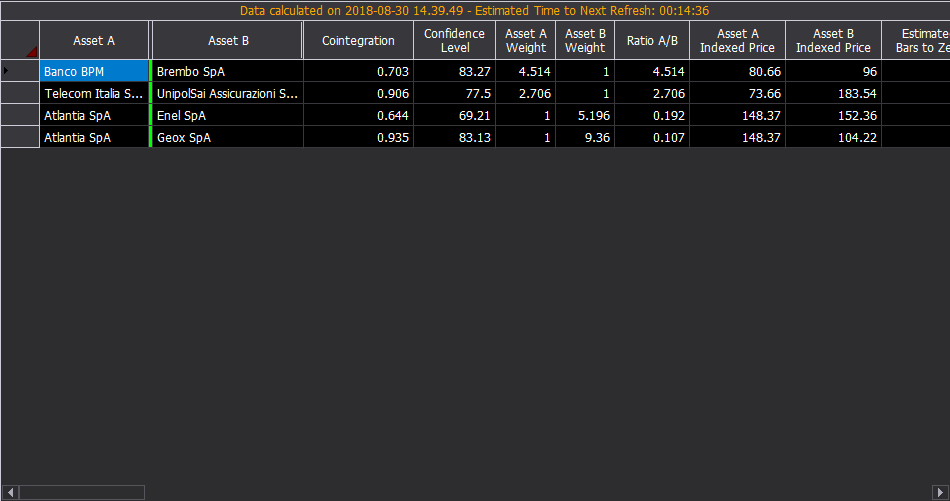
The definitive choice of pairs
So now in OverSpread Watchlist there are only pairs that actually elicit interest, may be those in the market, or those waiting to meet the parameters. However the pairs have been reduced and these are the ones to keep under control. To this double clicking on the pairs you can open the graphs to deepen the study, or you can apply alerts and all the other functions of OverSpread Watchlist . For more information on OverSpread Watchlist and all features, click here .
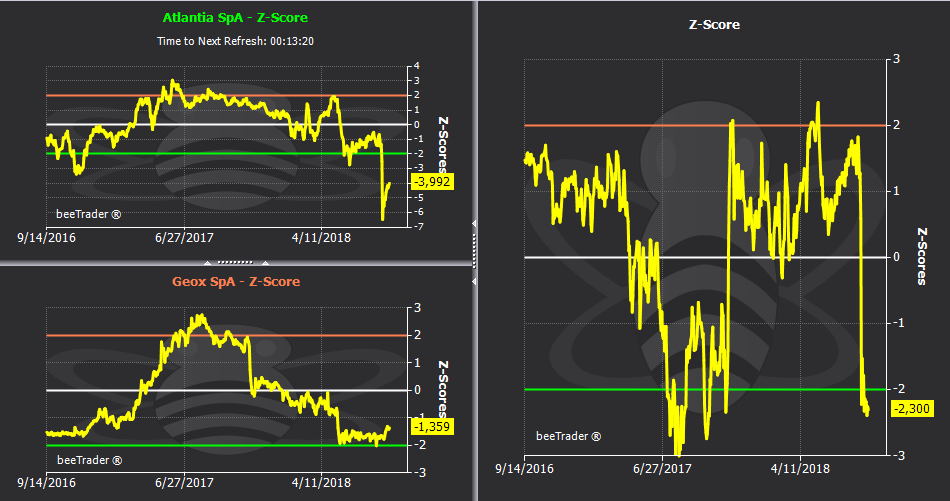
Analysis of single pairs
Double-clicking on the pairs opens the graphs to analyze all the parameters. There are nine different graphs shown in the specific pages of the manual: