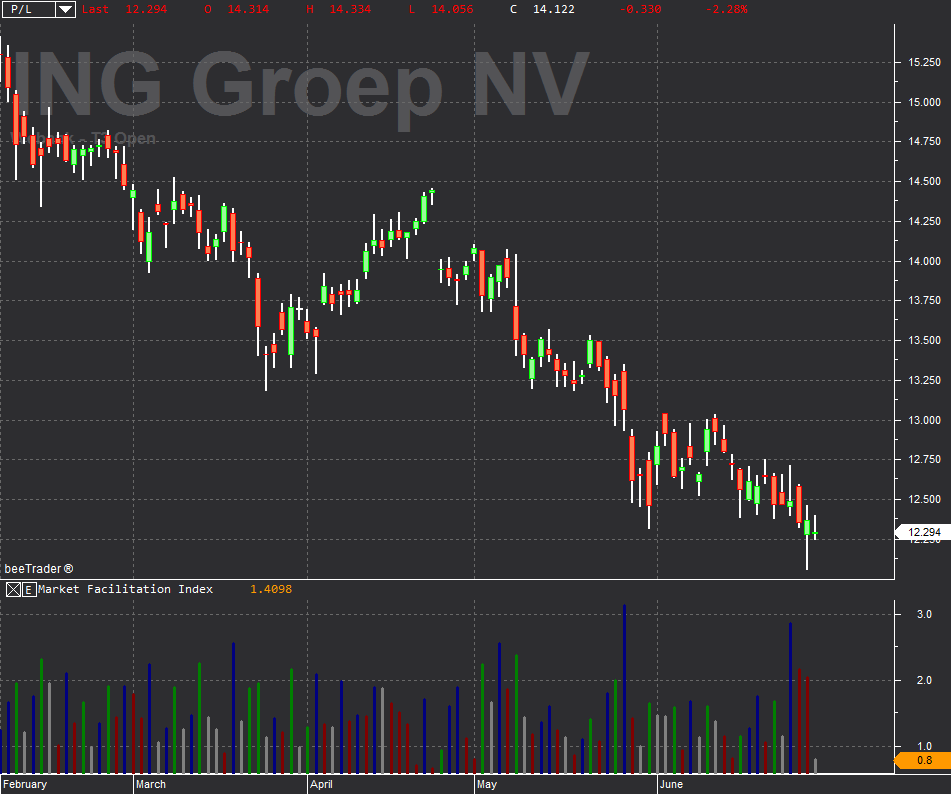
Market Facilitation Index
The Market Facilitation Index (MFI) allows, comparing it with trading volumes, to understand how much a trend is indicative and therefore “rideable” by traders.
1. GREEN BAR: Contemporary increase in volumes and the MFI index . It is a very active market situation, with many participants mostly following the direction of the trend, and this makes the price movement significant.
You can open positions in the direction of the trend.
If you have open positions against trends, better to close them.
2. BROWN BAR: Decrease in volumes and MFI index . The unattractive market, usually this happens at the end of a trend. However a similar situation could be the “fuse” for a big move in the price, in the case that many buyers or many sellers should enter the market, without finding an adequate number of counterparties.
This situation could therefore highlight a reversal of the trend, especially if there are several consecutive brown bars.
3. BLUE BAR: Decrease in volumes but increase in the MFI index . There is a trend, but without adequate volumes it is risky because it becomes probable that the market is supported by speculative maneuvers. Better not to stay in the market in a situation of this type.
4. PINK BAR: Volumes increase but the MFI index decreases : market in great activity, but does not express a decided trend because the last battle between bulls and bears is underway, as demonstrated by the high volume. There may be a great opportunity as soon as this battle ends and a new trend is established.


