bee Put Finder
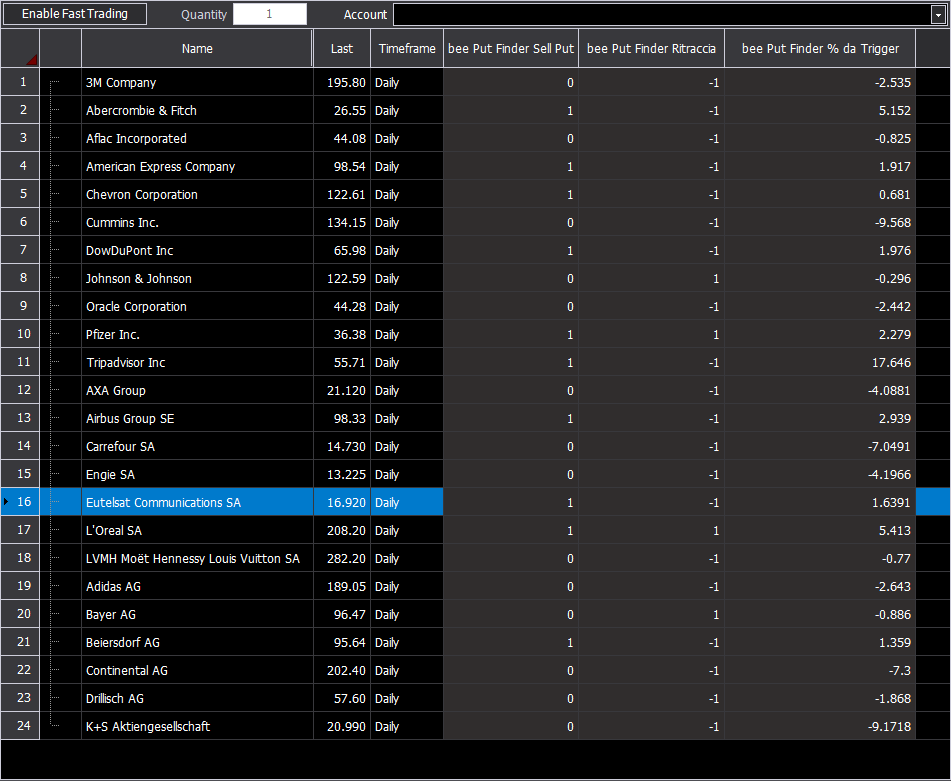
bee Put Finder is an indicator designed to be used on “Watchlist” in combination with the Historical Volatility indicator (already present), to quickly find the financial instrument on which to build upward strategies. In practice it is the stocks that have the best set-up to sell Put on them, obviously covered.
It is composed of three columns that show us:
1) “SellPut”: if it is 1 it means that it is a stock on which Put is sold, if it is 0 it means NO!
2) “Retrace”: if it is 1 it means that also the TREND is in continuation and there is no retracement;
3) “% from Trigger”: indicates the percentage distance of the financial instrument from the trigger value, that value which makes it Long. (look for the lowest value).
Examples:
1, 1, 2 = means that it is from Sell Put, in TREND and is just 2% from the trigger;
1, -1, 2 = means that it is from Sell Put, NOT in TREND and is 2% away from the value that declared it a Sell Put title. (Wait for Reverse of the Portrayal);
1, 1, 20 = excellent title but has already run quite a lot (20%).

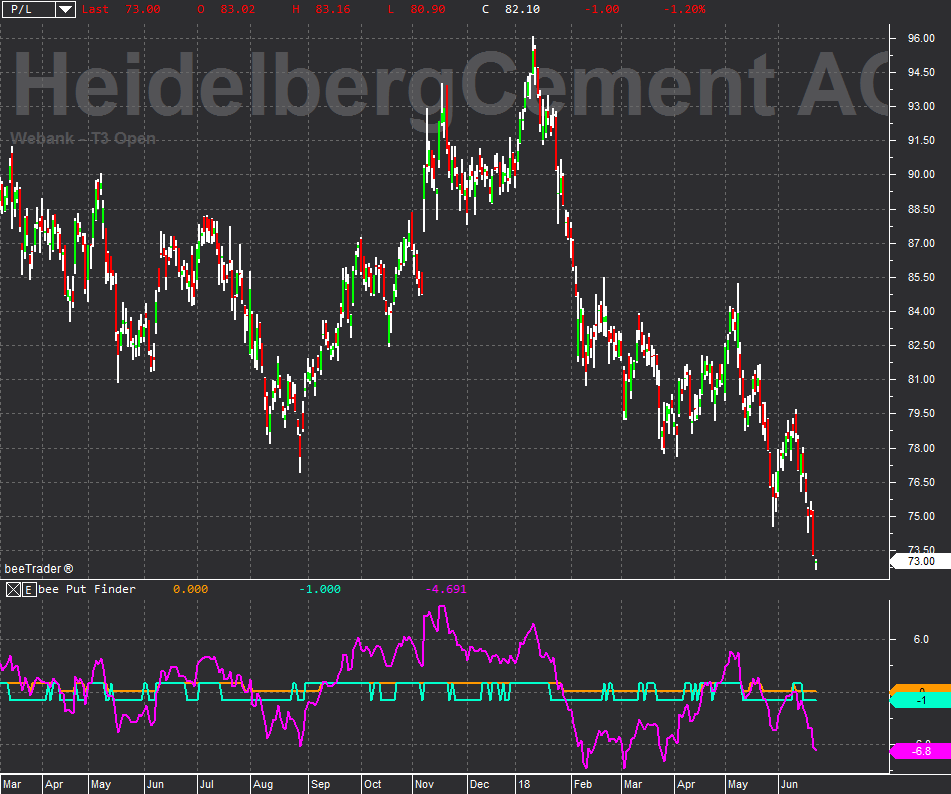
The bee Put Finder is an indicator designed to be used on Watchlist, however it can also be used on Chart, below is the explanation:
- orange line at 1,then ok for Sell put otherwise NO;
- blue line if at 1 ok the trend is always in progress, if -1 there is no longer the trend for which the put was sold or in any case the market is retracing;
- purple line is the percentage of deviation that the stock has made since the ok for the sale of the put was “triggered”.


