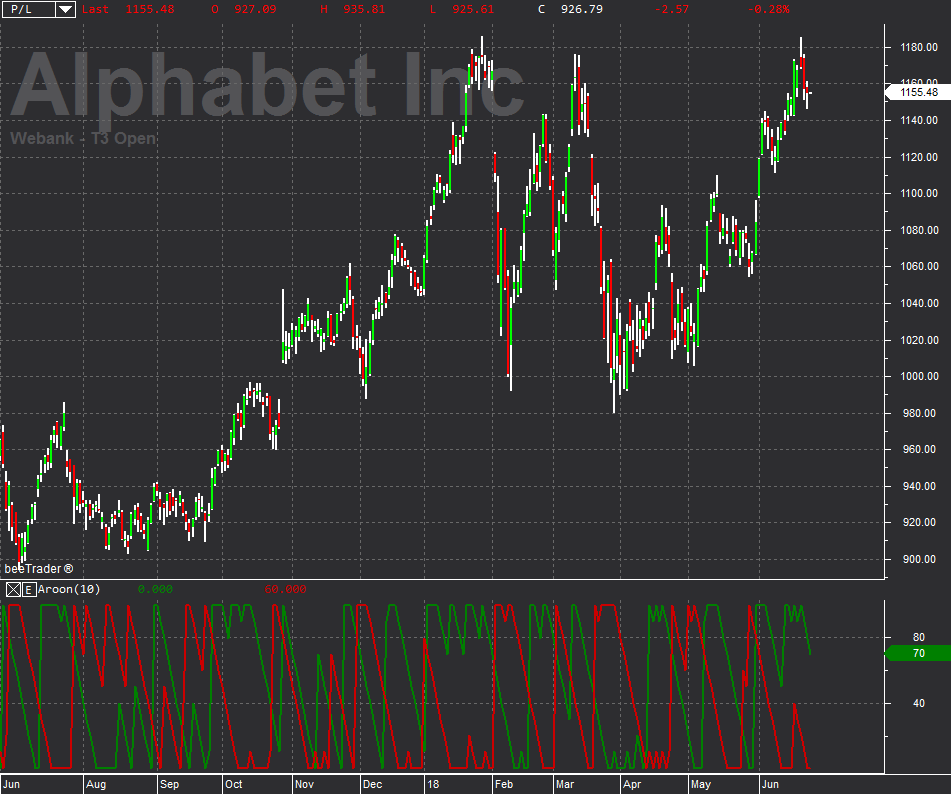
Aroon
The Aroon indicator is a technical analysis indicator that was developed by Tushar Chande in 1995. It is used to identify trends and the tendency to reverse them. This indicator is composed of two lines, one is called “Aroon Up” which serves to measure the strength of a positive trend and the other “Aroon Down” which measures the strength of a negative trend. The indicator shows the time it takes for the price to reach, given a starting point, the highest and lowest point over a given period of time. Both are expressed as a percentage based of the total time.
Both Aroon Up and Aroon Down therefore fluctuate between the values of 0 and 100. The closer the values are to 100 the stronger a trend is, the more they approach zero the weaker a trend is. So the lower the Aroon Up level, the weaker the positive trend and the stronger the negative trend and vice versa.
Operativity: For Aroon Up If it has reached the level of 100 the positive trend is very strong. The closer it will remain to 100 and the stronger the underlying trend will be. If it fluctuates between 80 and 100 it suggests a potential positive trend, this signal becomes stronger if at the same time Aroon Down is between 0 and 30. If it fluctuates between 0 and 20 it suggests weakness and therefore a possible trend reversal.
For Aroon Down If it has reached the level of 100 the negative trend is very strong. The closer it will remain to 100 and the stronger the underlying trend will be. If it fluctuates between 80 and 100 it suggests a potential negative trend, this signal becomes stronger if at the same time Aroon Up is between 0 and 30. If it fluctuates between 0 and 20 it suggests weakness and therefore a possible trend reversal.


