Z-Score
The Z-Score indicator can be used both on an asset chart and on a watchlist with a set of assets.
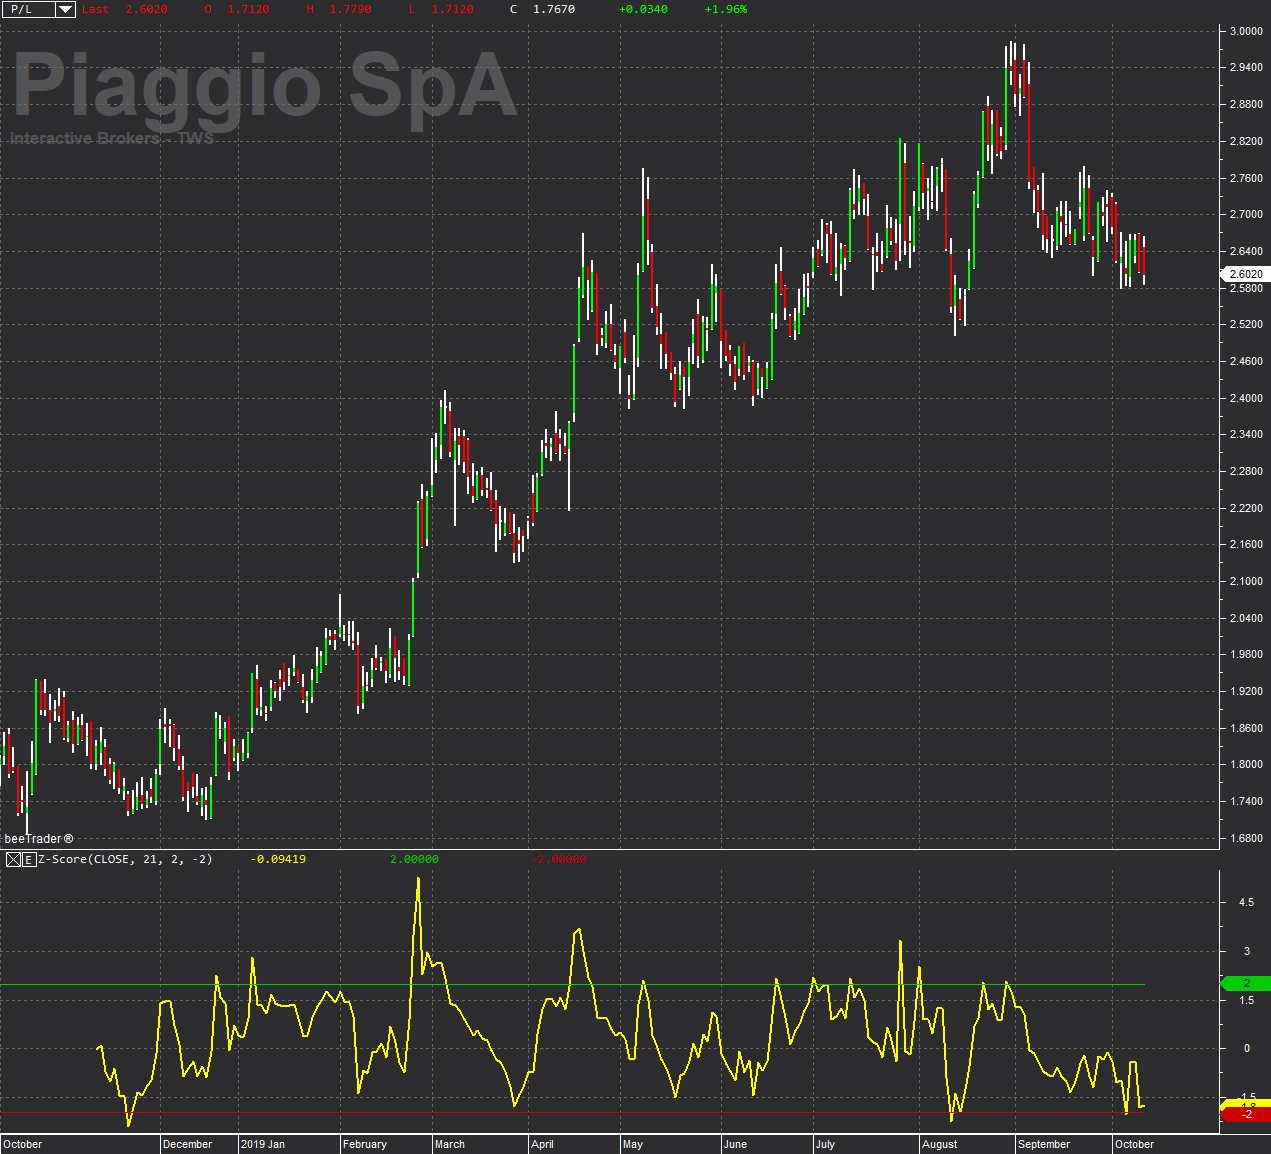
The Z-Score represents the distance of a point in a series of data from the average of the same, expressed in number of standard deviations.
The values above +2 indicate that there is a 95% probability that the values in the input vector decrease. Values less than -2 indicate that there is a 95% probability that the values in the input vector will increase.