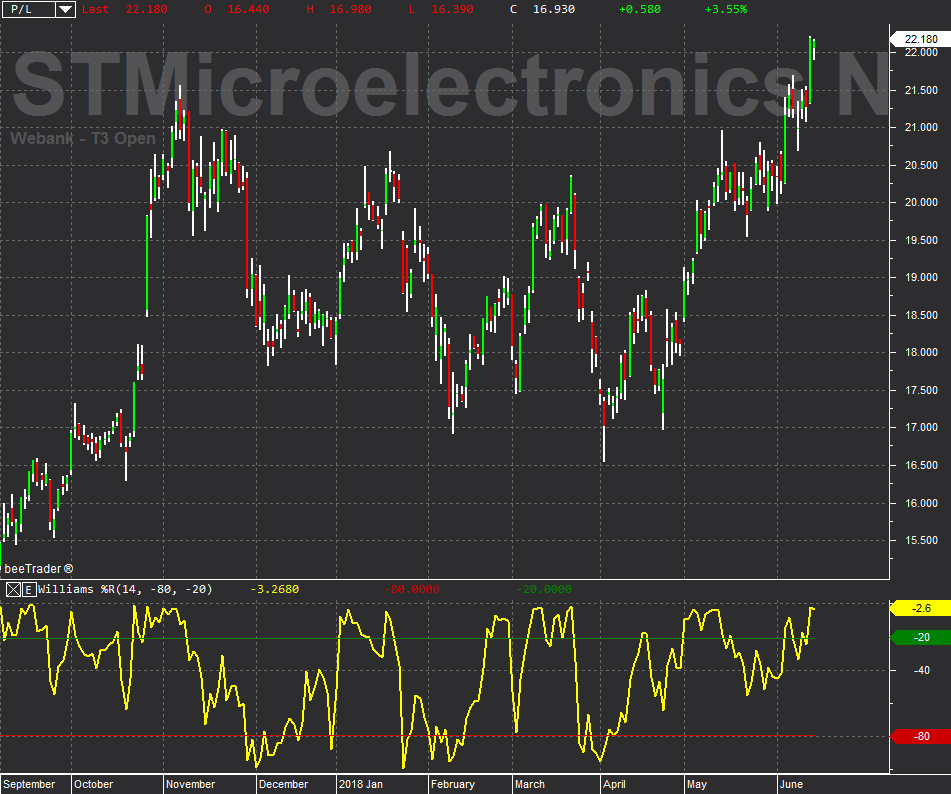
Williams %R
Williams% R is an indicator developed by the famous American trader Larry Williams, which fluctuates between 0 and -100, practically on an inverted scale. Two extreme zones of the index are identified whose reading however, occurs in a specular manner to that of the stochastic itself.
According to the author, the areas to be monitored are -20 and -80. Values above -20 represent overbought area, while values below -80 represent oversold area. The purchase signal is triggered when the indicator after falling into oversold (below -80) falls above this threshold. Conversely, the sale signal will start when the indicator in the overbought area (above -20) falls and violates this threshold.


