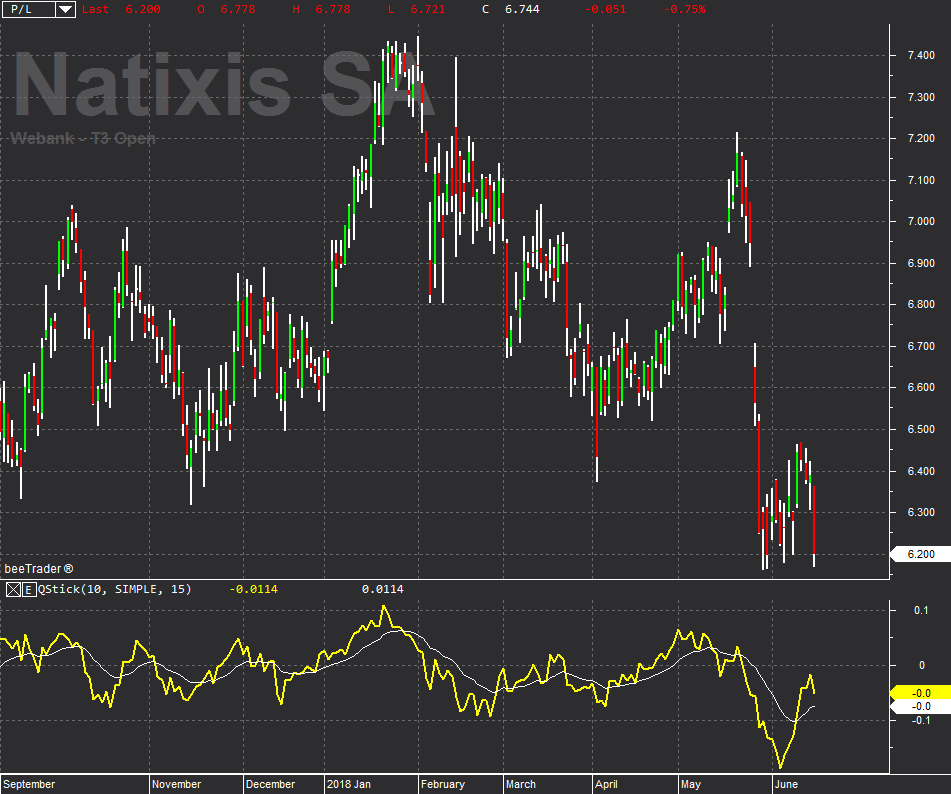
QStick Indicator
The QStick Indicator, designed by Tushar Chande, is used in intraday and very often as an aid to Candlestick analysis. The QStick Indicator is the “Moving Average” of the difference between the CLOSE and the OPEN. Difference that the author remembers to be the heart of the Candlestick analysis because it measures and represents the strength and consistency of bearish or bullish. The QStick Indicator is used on the advice of the designer with a time base of 8 periods, the operating signals are generated by crossing the zero line.
The BUY signal is generated when the QStick Indicator passes through the zero line and then when passing from the negative quadrant to the positive one. The SELL signal is triggered when the indicator drops back into negative territory below the zero line.


