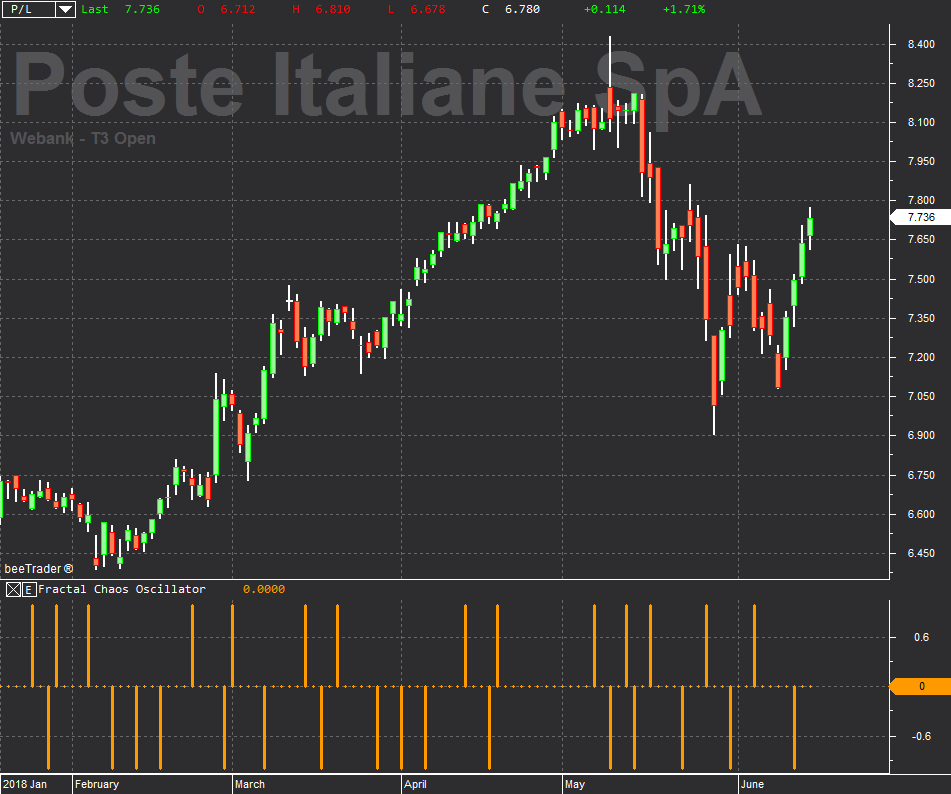
Fractal Chaos Oscillator
Widely used in mathematics, fractals are related to chaos theory and abstract mathematics and are useful when applied to the financial market, since the market itself is dynamic and non-linear. In trading, fractals are defined in their literal meaning, or used to divide larger trends into simple and predictable patterns, to predict market reversals and determine repetitive samples. The value of Fractal Chaos Oscillator is calculated as the difference between the most subtle movements of the market. In general, its value moves between -1.000 and 1.000. The higher the value of the Fractal Chaos Oscillator is, the more we can say that we follow a certain trend. Fractal Chaos Bands and Fractal Chaos Oscillator are similar in name, and indeed the two indicators are relatively similar in their interpretation. Both reflect the market trend, but in different ways. In a graph, the Fractal Chaos Bands resembles a band, made up of the two lines that are drawn through the highest and lowest market values in that time period. More dish the band is, the choppier the market. The more chaotic the band looks, the trendiest on the market.