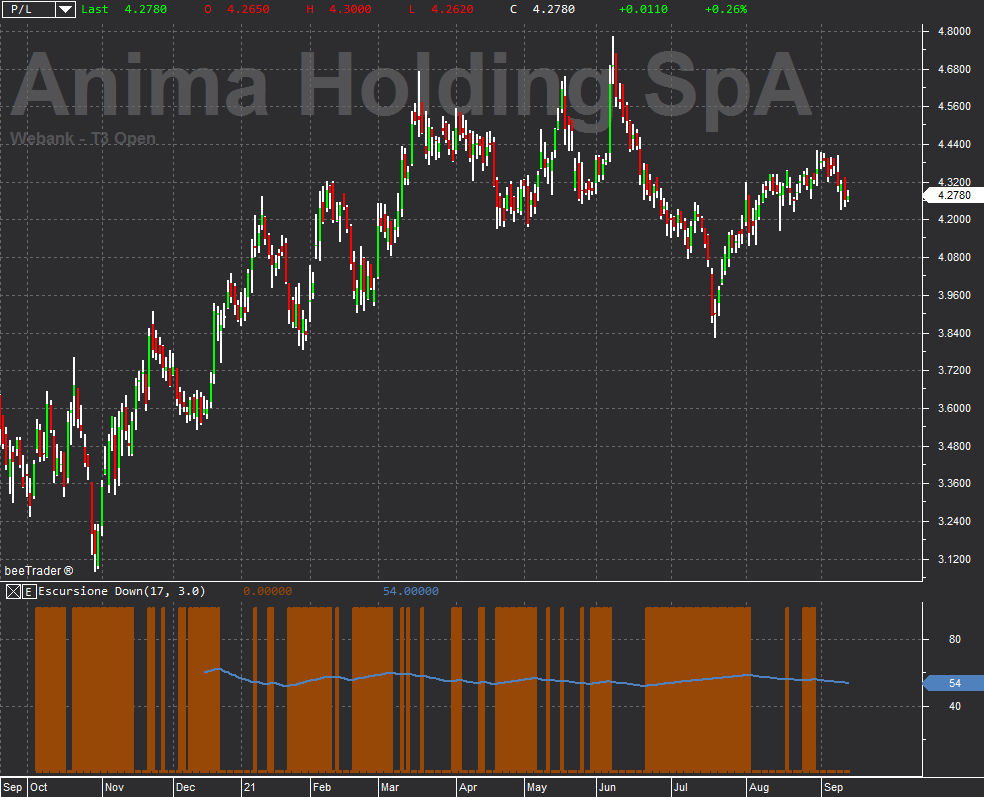
Escursione Down
The Escursione Down indicator can be useful when building options strategies. It represents the percentage of bars where price change towards lower values has reached a set value. This indicator must be used with Daily timeframe only.
It requires two parameters, @days which represents how many days, not bars, to use for calculating the price change, and @thresholdPercent which represents the percentage value of the price variance to use as the minimum threshold in the calculation.
In the example shown it is used with the parameters @days equal to 17 days and @thresholdPercent equal to 3%. The value calculated on Anima Holding SpA is equal to 54, thus indicating that in 54% of cases the downward price excursion was greater than or equal to 3% in periods of 17 days.
This indicator can be used on both Chart and Watchlist.


