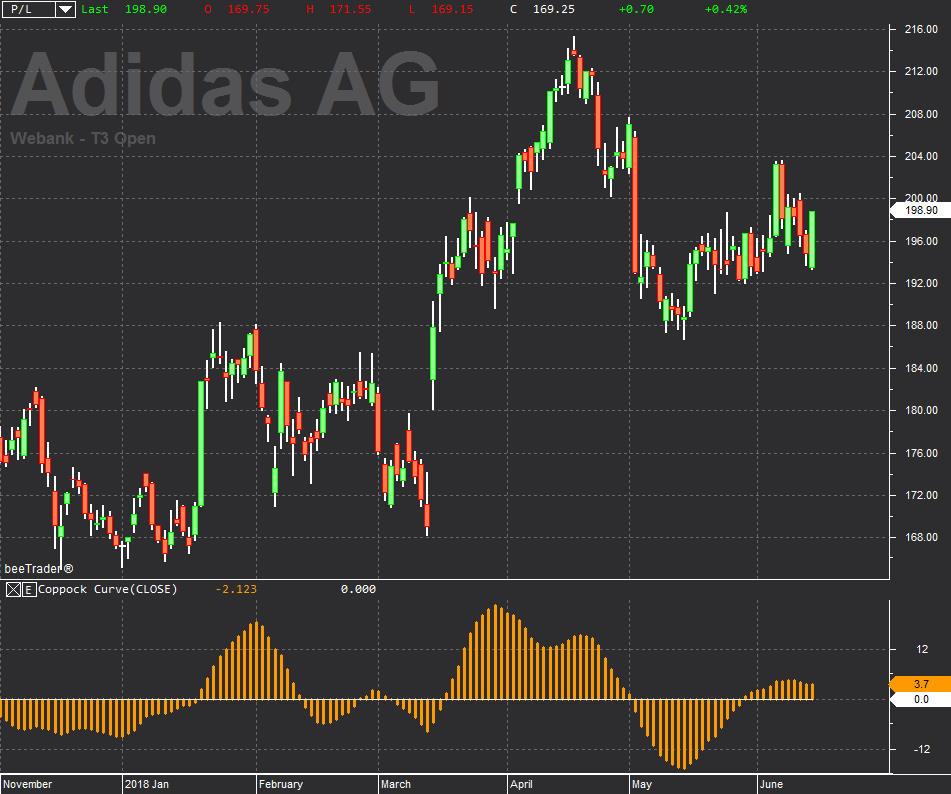
Coppock Curve
The Coppock Curve is a momentum indicator studied for long-term timeframes that was devised by Edwin Sedgwick Coppock way back in 1962. It is a trend-following indicator that generates purchase signals when it becomes negative, going over the zero line. By its construction it is an indicator that therefore does not show a new trend in a reactive way but rather when it is well established. Coppock devised this indicator for the S&P 500 and Dow Jones Industrial indices so it is advisable to use it on indices rather than on stocks or commodities, actually in the case of raw materials Coppock advised against using them when the lows on these instruments generally have a rounded shape, while on other instruments the minimums have a pointed shape.