Options Portfolio – Margins

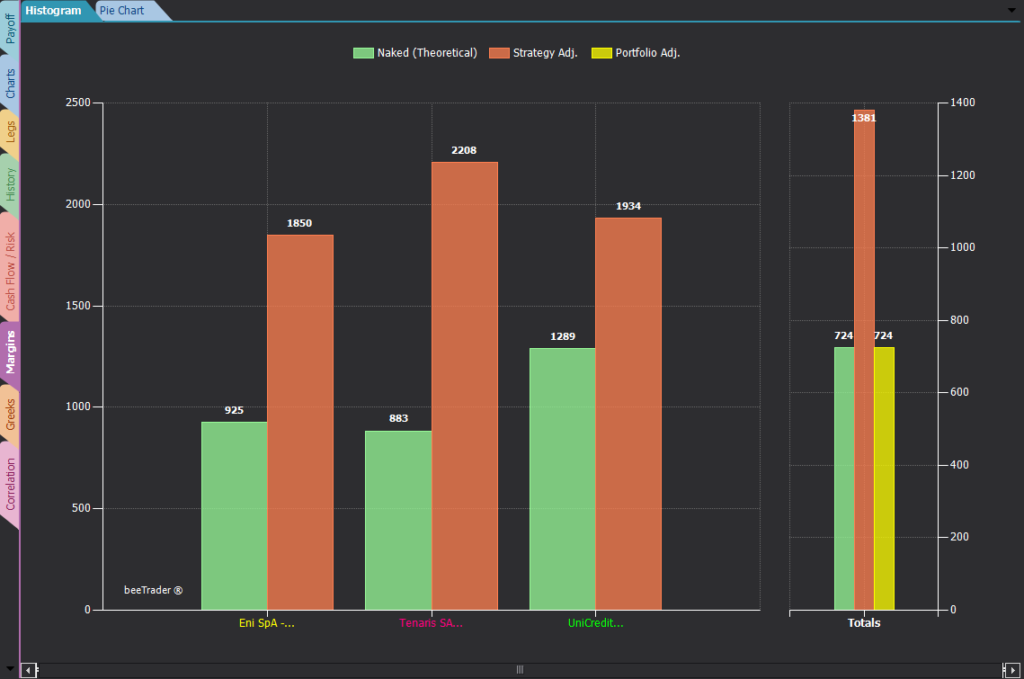
Histogram:
two histograms are represented by strategy. The margin calculated by beeTrader (green column) is the margin considering the naked position. At this margin each broker applies an additional percentage that is requested to the user, which is why it is possible to align both the margin of each strategy and the portfolio margin directly using the Margin Adjustment button.
For more information on Margins and Value at Risk, click here .

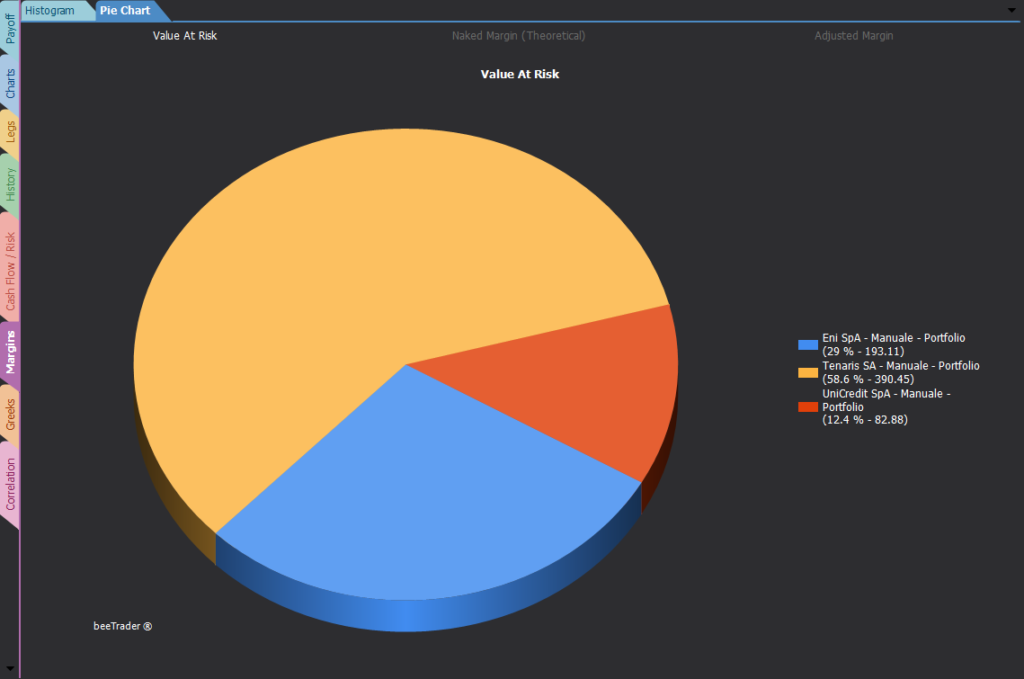
Pie Chart:
a pie chart is represented which divides the portfolio Var or the Theoretical Margins or the Adjusted Margins among the strategies contained in it.
For more information on Margins and Value at Risk, click here .

