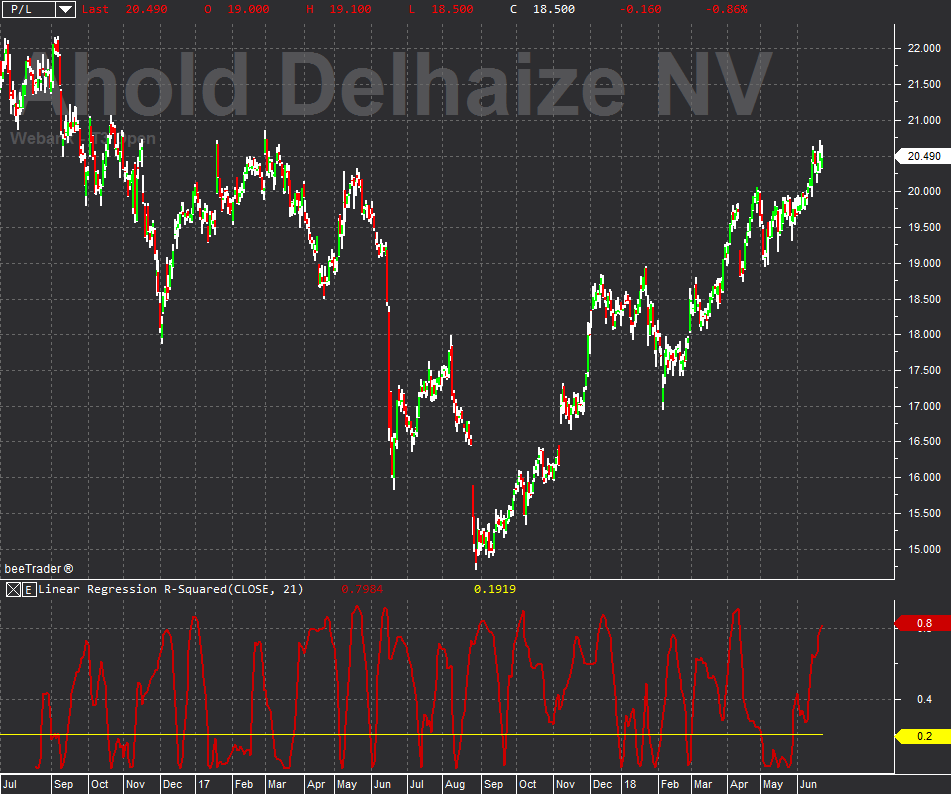
Linear Regression R-Squared
Linear regression is much used by technical analysts. While the slope of the linear regression line indicates the direction of the market trend, r-squared highlights the strength of the market itself: the more the prices move close to the regression line, the stronger the trend will be.
The value assumed by this variable identifies the percentage of price movement that can be explained by the linear regression, this means that a value of 0.3 (calculated over 21 periods) indicates that 30% of the price movement is included in the line of regression, while the remaining 70% is not related to linear regression. Low values express a high trend strength. To determine whether the trend is statistically significant for a Linear Regression built on “x” periods, refer to the table below that shows the required R-Squared values for a 95% confidence level, according to various time periods. If the value assumed by the indicator is lower than that indicated in the table, it must be deduced that the prices do not show a statistically significant trend.
R-Squared value periods
   5            0.77
  10            0.40
  14            0.27
  20            0.20
  25            0.16
  30            0.13
  50            0.08
  60            0.06
 120            0.03


beeTrader automatically also plots the value of R-Squared to define reliability, this value is called Critical Value.


