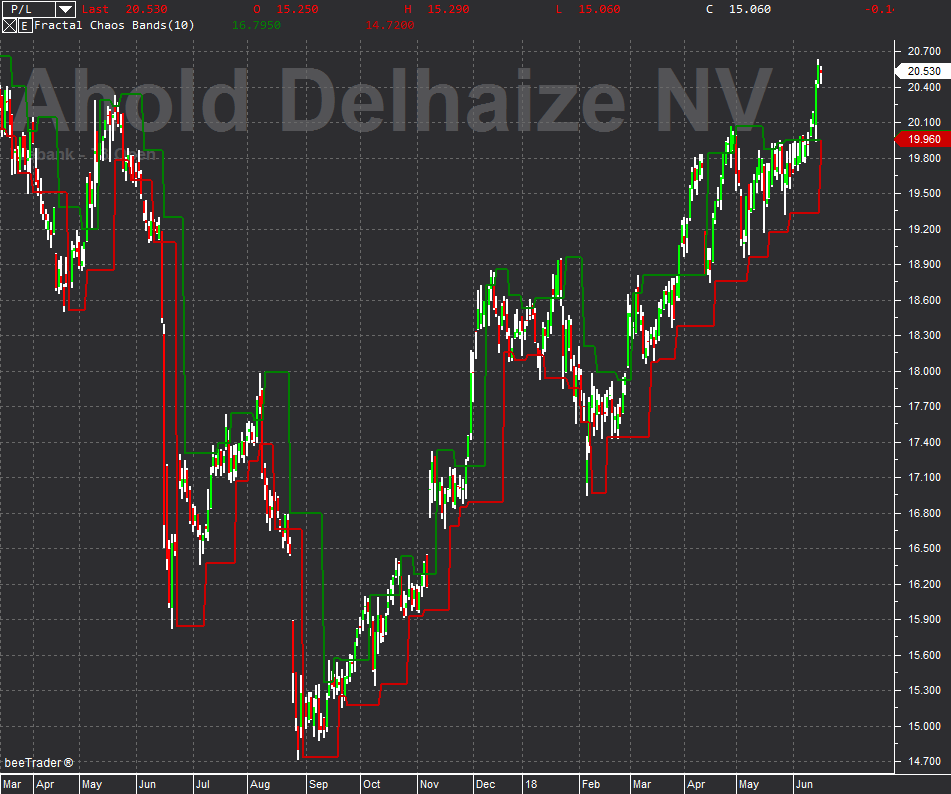
Fractal Chaos Bands
The Australian trader Edward William Dreiss was the first to start using fractal geometry as a way to measure asset price movements. Fractals are mathematical tools that essentially divide large trends into extremely easy and predictable patterns, for most traders they are therefore considered recurrent models that can predict reversals in chaotic price movements.
This indicator assumes that charts with different timeframes are difficult to observe if the time scale of the same is not available, the charts look the same, regardless of timeframe, the only difference is the time frame. The Fractal Chaos Bands can be used to determine what is happening with the currently set timeframe and is a great indicator to use in intraday trading.
The stock market moves in a chaotic way, but observing it with a higher timeframe, the movements follow a certain pattern that can be applied to more or less long periods of time and therefore we can use Fractal Chaos Bands to identify those patterns and detect when the market is Choppy or Trending or lateral or in trend.


