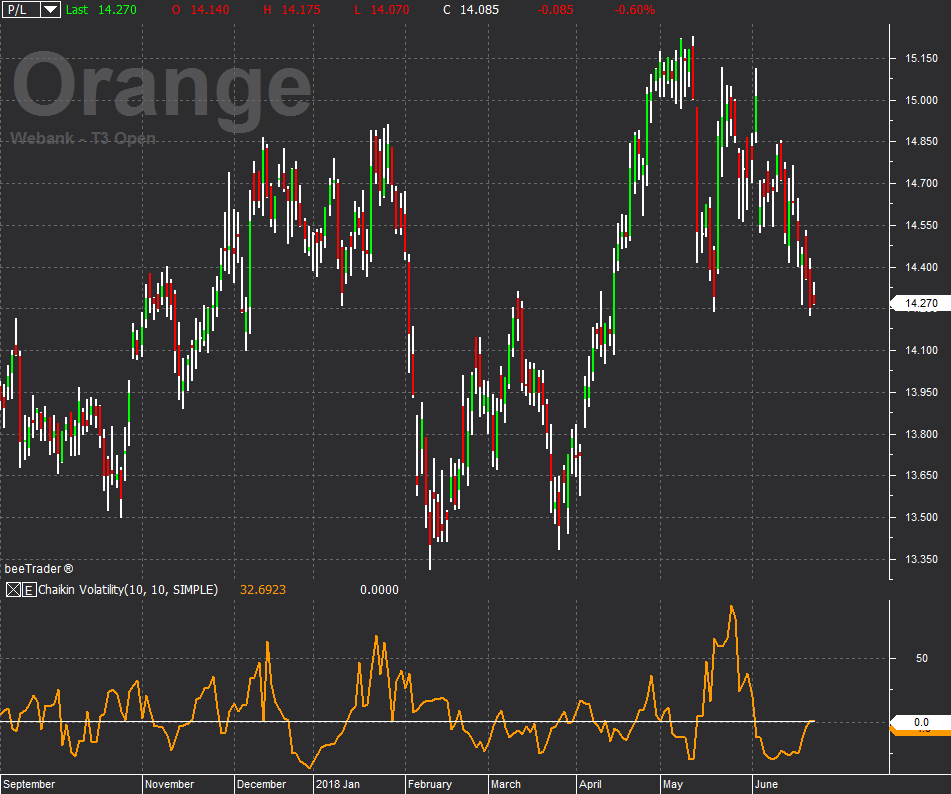
Chaikin volatility
Chaikin’s volatility indicator calculates the difference (spread) between HIGH and LOW prices. It therefore assesses the volatility of a series of historical data based on the amplitude between HIGH and LOW. To do this, in practice it calculates a mobile average of the difference between the maximum and the minimum and subsequently calculating the ROC on this average. The Chaikin does not take into account the gaps, which occur when the minimum traded price is above the previous day’s maximum or the maximum traded price is below the previous day’s minimum. Obviously, since the indicator measures the volatility of a stock, high values indicate that prices are changing a lot during the day, while low values indicate that prices remain relatively constant. According to Chaikin’s interpretation, a growth of a volume indicator in a relatively short time interval – and therefore an increase in the volatility measured by the Chaikin – means that prices approach their minimum (as when the stocks are sold in moments of panic), while a decrease in volatility over a longer period of time indicates that the prices are at the maximum (for example, in the condition of a mature bull market). A completely opposite method of interpreting the Chaikin is to assume that market highs are usually accompanied by increased volatility and the last stages of the lows by decreased volatility.


