bee Excursion on TimeFrame
bee Variation on TimeFrame identifies the High-Low excursion for the number of periods selected by comparing it with its Simple Moving Average. It requires two @periods period settings to calculate the High-Low and @avgPeriods excursion to calculate the Simple Moving Average of the excursion.
If you want to measure the weekly movement with the average of the 12 weeks of the three months, set the daily timeframe: @periods = 5 (days in a week), @avgPeriods = 60 (days in three months).
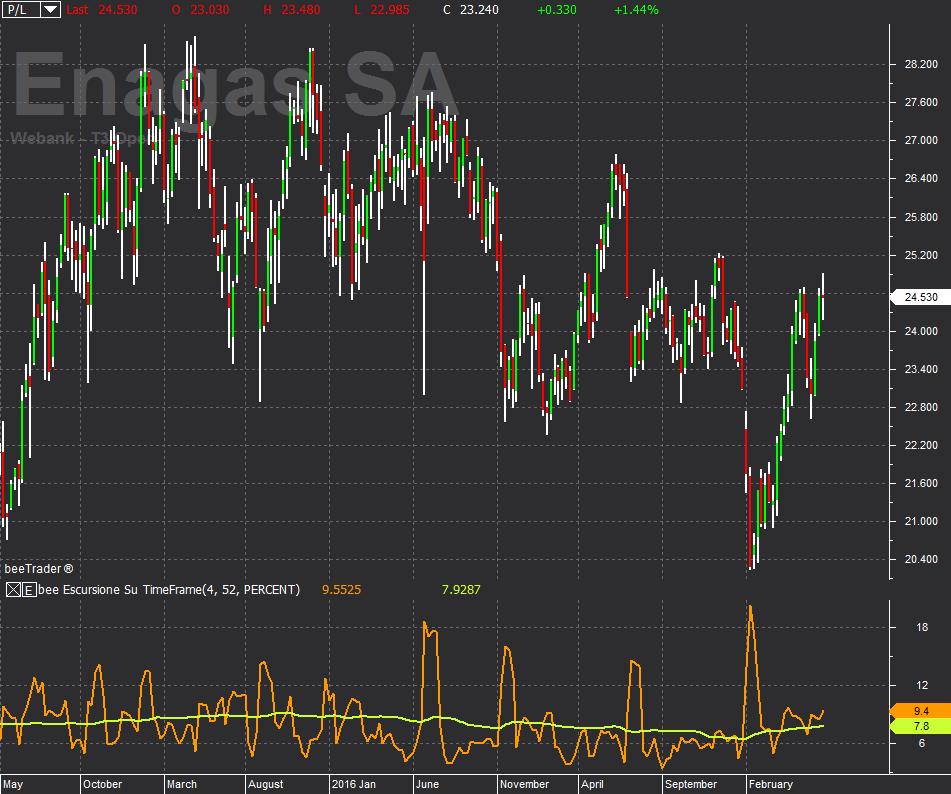
In the example shown, a Weekly timeframe was used over 4 periods with an average of 52 periods. The calculated values, for Enagas SA, indicate a High-Low excursion at 4 weeks (one month) of 9.4% and an average of 52 weeks (one year) of 7.8%.
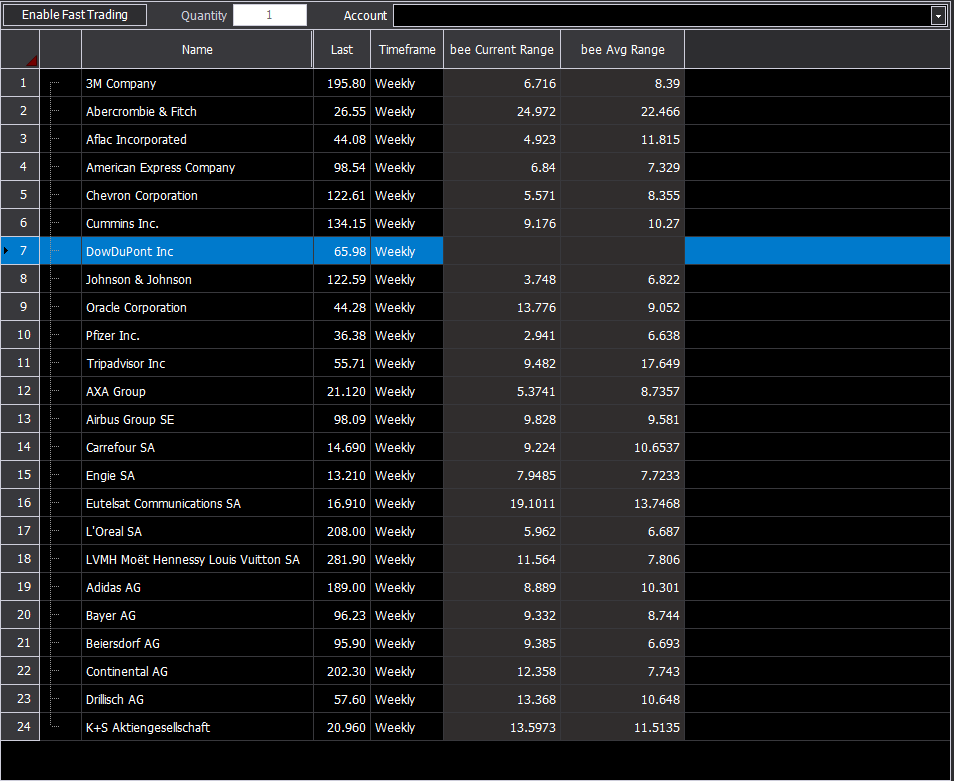
This indicator can be used both on Chart and on Watchlist.


