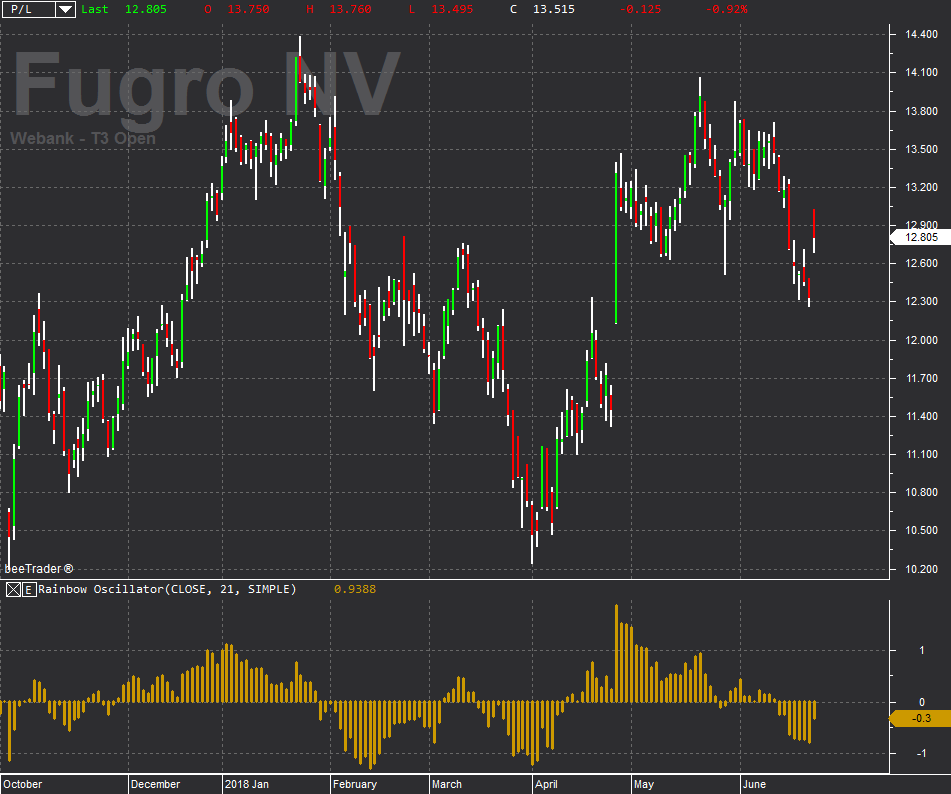
Rainbow Oscillator
The Rainbow Oscillator indicator was created by Mel Widner in 1997. In essence, the indicator is calculated by averaging the difference between the price and the values of all the “Moving Average” with a period less than or equal to the value of the @levels input (we recommend to display Rainbow Oscillator as a histogram). Just crossing indicates the potential change of the trend; Rainbow Oscillator is a typical trend-following indicator and you will need to be careful, because in lateral phases false signals will surely be generated. For this reason it can be more effective if used as confirmation of price breaks from congestion areas.