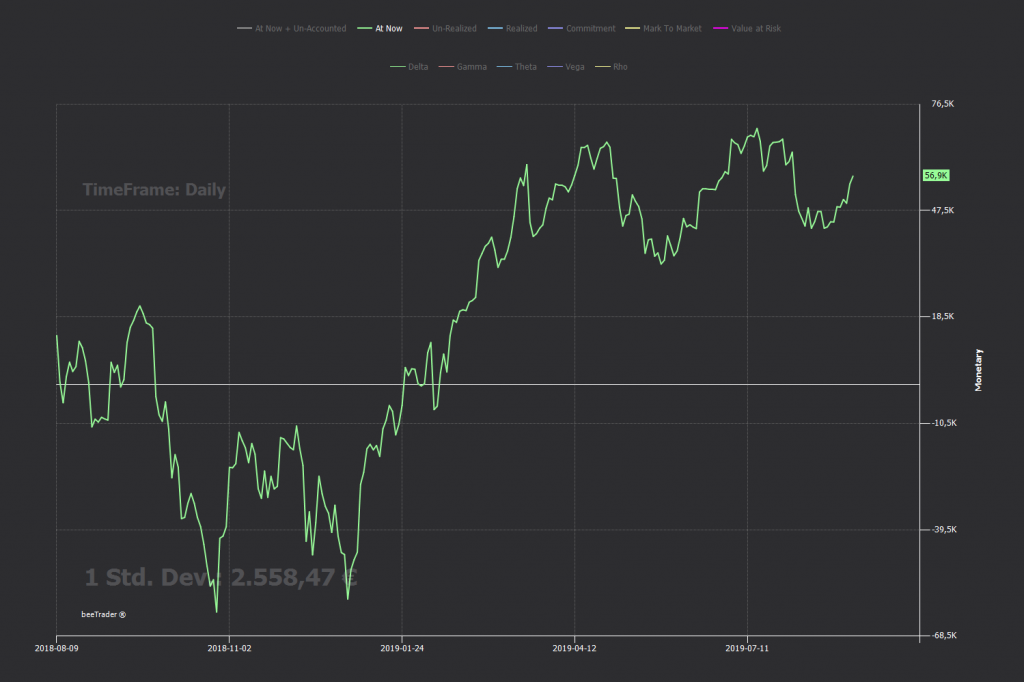
Options Portfolio – History
History Porfolio
the historical graph of the chosen parameter is displayed: At Now + Un-Accounted, At Now, Un-Realized, Realized, Commitment and Mark to Market. In addition, the Greek frets can also be viewed. The lower section shows the values of the point where the mouse is positioned.
With the right mouse button it is possible to choose the chart timeframe.
Note: for the values to be stored, the portfolio must be open and beeTrader connected to the broker.
History Strategies
the historical graph of the chosen parameter is displayed: At Now + Un-Accounted, At Now, Un-Realized, Realized, Commitment and Mark to Market, for all the strategies that make up the portfolio. In the lower part, depending on the selected parameter, the numerical value for each strategy of the point where the mouse is positioned is shown.
With the right mouse button it is possible to choose the chart timeframe.
Note: for the values to be stored, the portfolio must be open and beeTrader connected to the broker.


