
Charts – Backtest Optimization
beeTrader contains a powerful internal calculation engine that allows you to perform thousands of calculations in a few moments. The Optimization function of the signals allows the user, during Backtest operations, to optimize their signal in order to obtain the best possible combination.
Understand the Optimization function
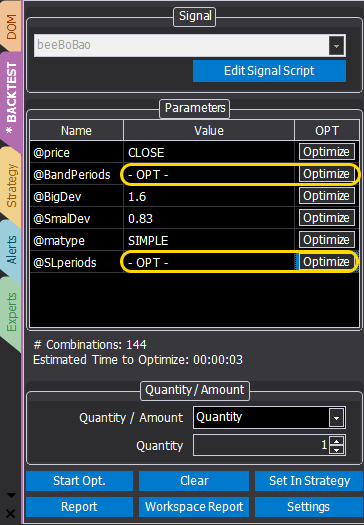
To access the optimization function it is necessary to select the signal parameters to be optimized, one or more than one.
To do this, click on the Optimize next to the selected parameter, then a window appears in which to set the values (minimum value, maximum value and step) that you want to use for optimization.
Once you click OK on the window is indicated – OPT – to indicate that that parameter will be subject to optimization.
Finally, click on the Start Opt button.

When the system has finished making the calculations, the Optimization Results window appears.
The optimization calculations are obviously influenced by the values set by the user, ie if many parameters are included in the optimization with wide ranges at reduced pitch, the system can take up to several minutes to perform the calculations because the combinations are very numerous .
The Open Sidebar button opens the Equity Line chart to the right of the results grid.
Grid
The grid shows all the values obtained with the various combinations of the chosen parameters. The grid is orientable, so clicking on the column heads it is possible to orientate the values for Total Nel Profit for example, or for all the other properties displayed.
The displayed properties can be selected by clicking the Choose Properties button.
3d Analysis
In the 3D chart, which is available when two or more parameters are optimized, it is possible to check the signal behavior during the backtest, point by point.