
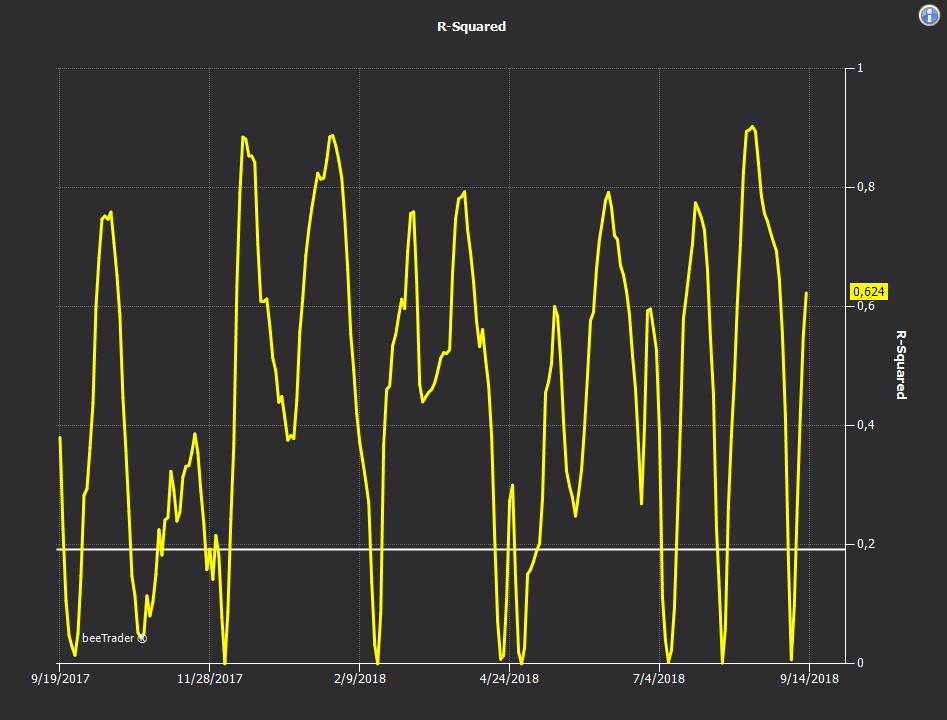
Chart – R-Squared
Statistical Meaning: the R-squared (also known as the determination coefficient) represents an indicator that, starting from the regression line, summarizes in a single value how much the analyzed quantity diverges from this line on average.
What it tells us: R-squared can take values between 0 and 1. If it is equal to 1 then there exists a perfect linear relationship between the analyzed phenomenon and its regression line. If equal to 0 there is no linear relationship between the two variables while the values between 0 and 1 give an indication of the effectiveness of the regression line to synthesize the object of the analysis.
What I have to observe: since we are calculating the R-Squared on the Z-Score graph, and since our strategy gains if the Z-Score deviates and then returns to its average, then it means that we have to look for Low R-Squared values (that is low correlation). To give the user the immediacy in the interpretation, the graph is also drawn a horizontal line that represents the critical value below which the Z-Score graph has behaviors coherent with the strategy.