
beePrice Distribution
Video Tutorial
beeTrader – beePrice Distribution
Understanding the beePrice Distribution function

beePrice Distribution offers the possibility to view the price levels and volumes traded for certain time intervals, thus obtaining information on the levels of support or resistance that have been created. It will also be possible to evaluate when these levels have been obtained and with how many exchanges, also evaluating a measure of “strength”.
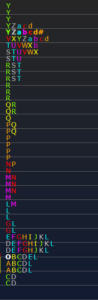
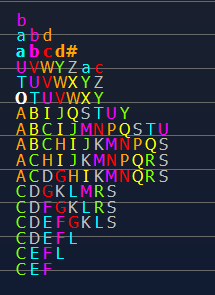
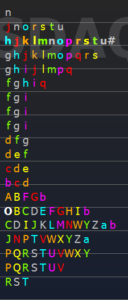
Through the Settings window, the display can be chosen in whole colored blocks or by letters of the alphabet, also colored. The blocks or letters group the prices at which exchanges take place in the time selected by the user. These blocks are called Convenience Point which for convenience we call CP.
The distribution of prices during the day will contain all the CPs obtained in the selected timeframe. That is, the distribution chart will have a first block (CP) or letter “A” which will correspond to the first price traded. This first CP will contain all the trades that took place in the selected price range and can be followed by other CPs with the same letter or color until the time selected in the Settings expires. At the end of this time, new blocks identified by the following letter with a different color will be added to the graph, repeating the same construction until the market closes.
From this moment a block (CP) of different color or letter “B” will be represented which will behave as described above until the timeframe expires to continue with a new block (CP) and a new letter … until the market closes.
In an 8-hour market, if we suppose we set the timeframe to 30 minutes we will have a distribution of blocks or letters which will be respectively: (8 hours / 30 minutes = 16) 16 different colors 16 letters of the alphabet (from A to P)
To the right of the letters there is a red asterisk and the symbol # to indicate the Last which at the end of trading will correspond to the Close.
It is possible to display labeled horizontal lines that correspond to:
-
ACT: shows the longest price traded in the current distribution. The value shown is the average of all the prices that make up all the blocks corresponding to the longest line;
-
ACTvol: shows the price at which the largest number of exchanges occurred, not to be confused with the largest number of volumes. Promotes 1000 exchanges from 1 share rather than 1 exchange from 1000 shares.
You can also display colored vertical zones that correspond to:
-
Race: price deviation in the first two CPs (the CP timeframe is settable);
-
Opening Range: price deviation in the first 5 minutes of trading (settable);
-
Trades Area: area that represents 70% of the number of CP. 70% of the CPs are calculated starting from the ACT line;
-
Trades Area Volume: area in which 70% of volumes are concentrated;
-
Race 1-2-3: up to 3 different vertical zones can be selected that represent the time range of the RACE histogram plus the percentage selected by the user.
-
Extended Act: forward lines can be projected from the ends of these histograms to intercept the current value with respect to the histogram value;
-
Users Lines: allows you to draw lines at set prices and names.
And finally, you can view the histograms of the Volumes that can be set above or in front of the distribution.
Below is the description of the menu commands:
- Timeframe: choose the profile configuration between daily or weekly. Each profile will therefore contain the exchanges of a day or a week (5 days);
- CP Price Range: can be Step or Price. By default it is set as Step and using the buttons below (+ and -) it is possible to increase or decrease the price range of the instrument contained in a CP (letter or block). If set as Price, it allows you to manually set the price range contained in a CP (letter or block) in the cell below. Take for example the future of the DAX: if the value 5 is set, it means that a new CP (letter or block) will be generated when the price has exceeded the 5 points set, so if the first price was 12500 assigned to the CP “A” , the CP “B” will be created when the traded price will be 12505 or 12495;
- ACT: shows the price most traded in the current distribution. The value shown is the average of all the prices that make up all the blocks corresponding to the longest line;
- ACT Volume: shows the price at which the largest number of exchanges occurred, not to be confused with the largest number of volumes. Favors 1000 exchanges from 1 share rather than 1 exchange from 1000 shares;
- Trades Area: allows you to view a vertical zone that represents 70% of the number of CPs. 70% of the CPs are calculated starting from the ACT line;
- Trads Area Volume: allows you to view a vertical area where 70% of volumes are concentrated ;
- Race: allows you to view a vertical area that represents price deviation in the first two CPs. The timeframe is settable from the Settings window;
- Opening Range: allows you to view a vertical area that represents the price deviation in the first minutes of opening. The minutes setting can be set from the Settings window. Default is 5 minutes;
- Left: command referring to Race histograms, Opening Range, Trades Area and Trades Area Volume, allows you to view them on the left of the block diagram of the price distribution;
- Right: command referring to Race histograms, Opening Range, Trades Area and Trades Area Volume, allows you to view them to the right of the block diagram of the price distribution;
- Left & Right: command referring to Race histograms, Opening Range, Trades Area and Trades Area Volume, allows you to view Race and Opening Range to the left, Trades Area and Trades Area Volume to the right of the price distribution block diagram;
- Off: disables the display of volumes;
- Overlay: enables the display of volumes at a lower level than the block diagram of the price distribution, so that the latter is superimposed on the volumes;
- Right Side: enables the display of volumes on the right block graph of the price distribution.
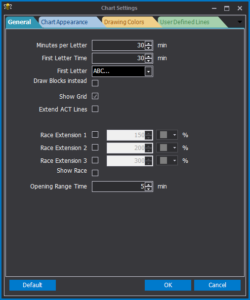
Chart Settings
-
Minutes for Letter: sets the time duration of the letters (or blocks) before the creation of the next one;
- First Letter Time: sets the time duration of the first letter (or block);
- First Letter: set which will be the first letter;
- Draw Blocks instead of Letters: if selected in the graph blocks will be drawn instead of letters;
- Show Grid: show or hide the grid;
- Extend ACT Lines: extends the ACT lines to the right;
-
Race Extension 1: set the first percentage of time extension for the Race and display the result;
-
Race Extension 2: set the second percentage of time extension for the Race and display the result;
-
Race Extension 3: set the third percentage of time extension for the Race and display the result;
-
Show Race Extension Label: shows the label related to the temporal extensions of the Race;
-
Opening Range Time: sets the duration of the Opening Range.
-
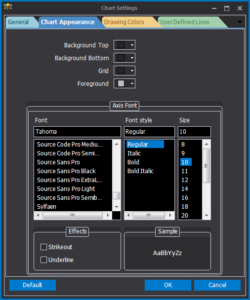
Background Top: set the Top background color ;
-
Background Bottom: set the Bottom background color ;
-
Grid: set the grid color;
-
Foreground: set the color of the texts in the foreground;
-
Axis Font: set the character of the axes written.
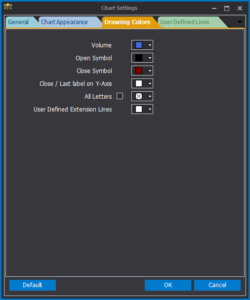
- Volume: sets the color of the volume histograms;
- Open Symbol: sets the color of the day’s opening symbol (letter O);
- Close Symbol: set the color of the Close symbol (*);
- Close / Last label on Y-Axis: sets the color of the Lat price label on the Y axis;
- All Letters: allows you to color all the letters with the same color;
- User Defined Extension Lines: sets the color of lines drawn by the user.
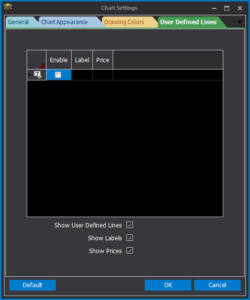
In this section of the Settings window the user has the ability to draw horizontal lines on the chart, can set the price level and,if needed, a label.
Example of use
Good morning starts in the morning and so, if we accept this adage, the first hour of the market will give us the references for the day.
The price excursion that will be obtained and that we call RACE will offer the first two price levels keeping in mind that if it will be a large area (referring to the previous days) the supports and resistances will be particularly strong and the market will adapt for a lateral day .
On the contrary it will be a day in trend if the RACE is not very large.
In this case the 100, 150 or 200% extensions of the RACE time range will be broken in succession.
Characteristics of the days:
-
Wide race and unimportant extensions: this type of configuration can be considered a lateral day;
-
Small race and extension break: this type of configuration can be considered a trend day;
-
Small race, break of extensions and then stationary prices: this type of configuration, with double distribution, can be considered an inversion figure and the value expressed by the points of major exchange that will be highlighted as ACT is particularly important.
Trend
Lateral
Double Distribution
The logic of beePrice Distribution
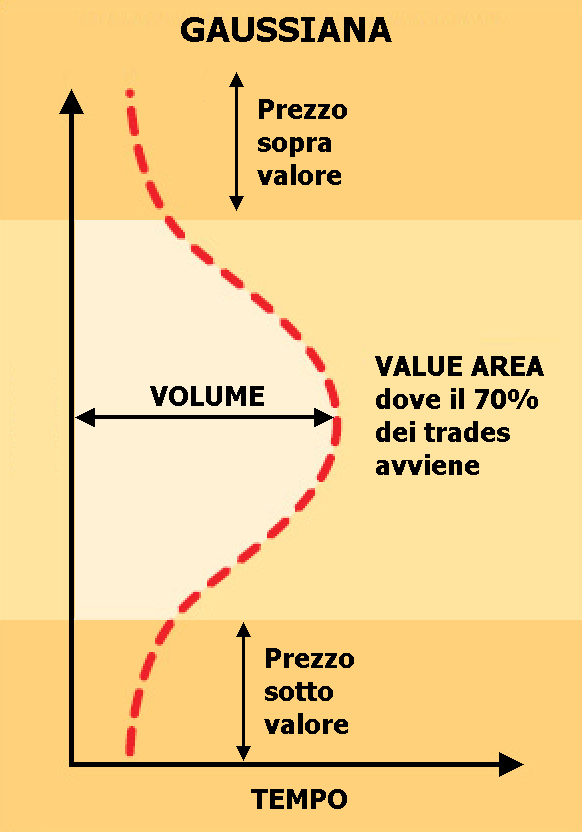
Unlike the most commonly used indicators, beePrice Distribution takes the data from each daily trading session and organizes it in such a way that it is possible to understand who is in control of the market and where the appropriate value is received.
We are used to seeing market data organized by time, price and volume. With beePrice Distribution the data values have an extra attribute: it also takes the value “where” the prices were performed during the session.
All the information that is received starts from the axiom that in most days 70% of prices move within an area that is bounded by a Gaussian bell.
This area is the area of Value, the area in which the majority of players agree in recognizing the fair value of the asset.
The beePrice Distribution therefore detects reference values during the trading session. These values are supports and resistances that the good and experienced trader manages to exploit to obtain information on the future direction (intraday) of the trend of the asset.